Embed data health tile in dashboards beta
With data health tiles, stakeholders will get an at-a-glance confirmation on whether the data they’re looking at is stale or degraded. This trust signal allows teams to immediately go back into Explorer to see more details and investigate issues.
Data health tile is currently available in open beta.
The data health tile:
- Distills trust signals for data consumers.
- Deep links you into dbt Explorer where you can further dive into upstream data issues.
- Provides richer information and makes it easier to debug.
- Revamps the existing, job-based tiles.
 Embed data health tiles in your dashboards to distill trust signals for data consumers.
Prerequisites
- You must have a dbt Cloud account on a Team or Enterprise plan.
- You must be an account admin to set up service tokens.
- You must have develop permissions.
- Have exposures configured in your project and source freshness enabled in the job that generates this exposure.
View exposure in dbt Explorer
First, be sure to enable source freshness in the job that generates this exposure.
- Navigate to dbt Explorer by clicking on the Explore link in the navigation.
- In the main Overview page, go to the left navigation.
- Under the Resources tab, click on Exposures to view the exposures list.
- Select a dashboard exposure and go to the General tab to view the data health information.
- In this tab, you’ll see:
- Data health status: Data freshness passed, Data quality passed, Data may be stale, Data quality degraded
- Name of the exposure.
- Resource type (model, source, and so on).
- Dashboard status: Failure, Pass, Stale.
- You can also see the last check completed, the last check time, and the last check duration.
- You can also click the Open Dashboard button on the upper right to immediately view this in your analytics tool.
 View an exposure in dbt Explorer.
Embed in your dashboard
Once you’ve navigated to the auto-exposure in dbt Explorer, you’ll need to set up your dashboard status tile and service token:
- Go to Account settings in dbt Cloud.
- Select API tokens in the left sidebar and then Service tokens.
- Click on Create service token and give it a name.
- Select the Metadata Only permission. This token will be used to embed the exposure tile in your dashboard in the later steps.
 Set up your dashboard status tile and service token to embed a data health tile
- Copy the Metadata Only token and save it in a secure location. You'll need it token in the next steps.
- Navigate back to dbt Explorer and select an exposure.
- Below the Data health section, expand on the toggle for instructions on how to embed the exposure tile (if you're an account admin with develop permissions).
- In the expanded toggle, you'll see a text field where you can paste your Metadata Only token.
 Expand the toggle to embded data health tile into your dashboard.
- Once you’ve pasted your token, you can select either URL or iFrame depending on which you need to install into your dashboard.
If your analytics tool supports iFrames, you can embed the dashboard tile within it.
Embed data health tile in Tableau
To embed the data health tile in Tableau, follow these steps:
-
Ensure you've copied the embed iFrame content in dbt Explorer.
-
For the revamped environment-based exposure tile you can insert these fields into the following iFrame, and then embed them with your dashboard. This is the iFrame that is available from the Exposure details page in dbt Explorer.
<iframe src='https://metadata.YOUR_ACCESS_URL/exposure-tile?uniqueId=<exposure_unique_id>&environmentType=production&environmentId=<environment_id>&token=<metadata_token>' />Note, replace the placeholders with your actual values.
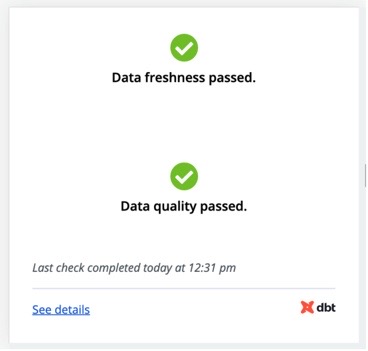
 Example of embedded iFrame
 Example of passing Data health tile in your dashboard.
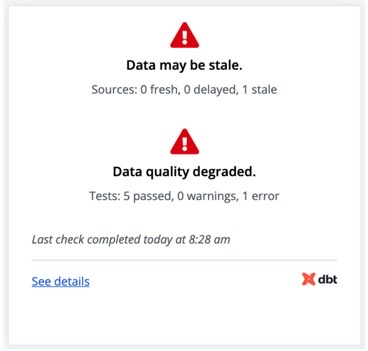
 Example of stale of degraded Data health tile in your dashboard.
-
For the job-based exposure tile you can insert these three fields into the following iFrame, and then embed them with your dashboard. The next section will have more details on the job-based exposure tile.
<iframe src='https://metadata.YOUR_ACCESS_URL/exposure-tile?name=<exposure_name>&environment_id=<environment_id>&token=<metadata_token>' />Note, replace the placeholders with your actual values.
Job-based data health Legacy
The default experience is the environment-based data health tile with dbt Explorer.
This section is for legacy job-based data health tiles. If you're using the revamped environment-based exposure tile, refer to the previous section. Expand the following to learn more about the legacy job-based data health tile.