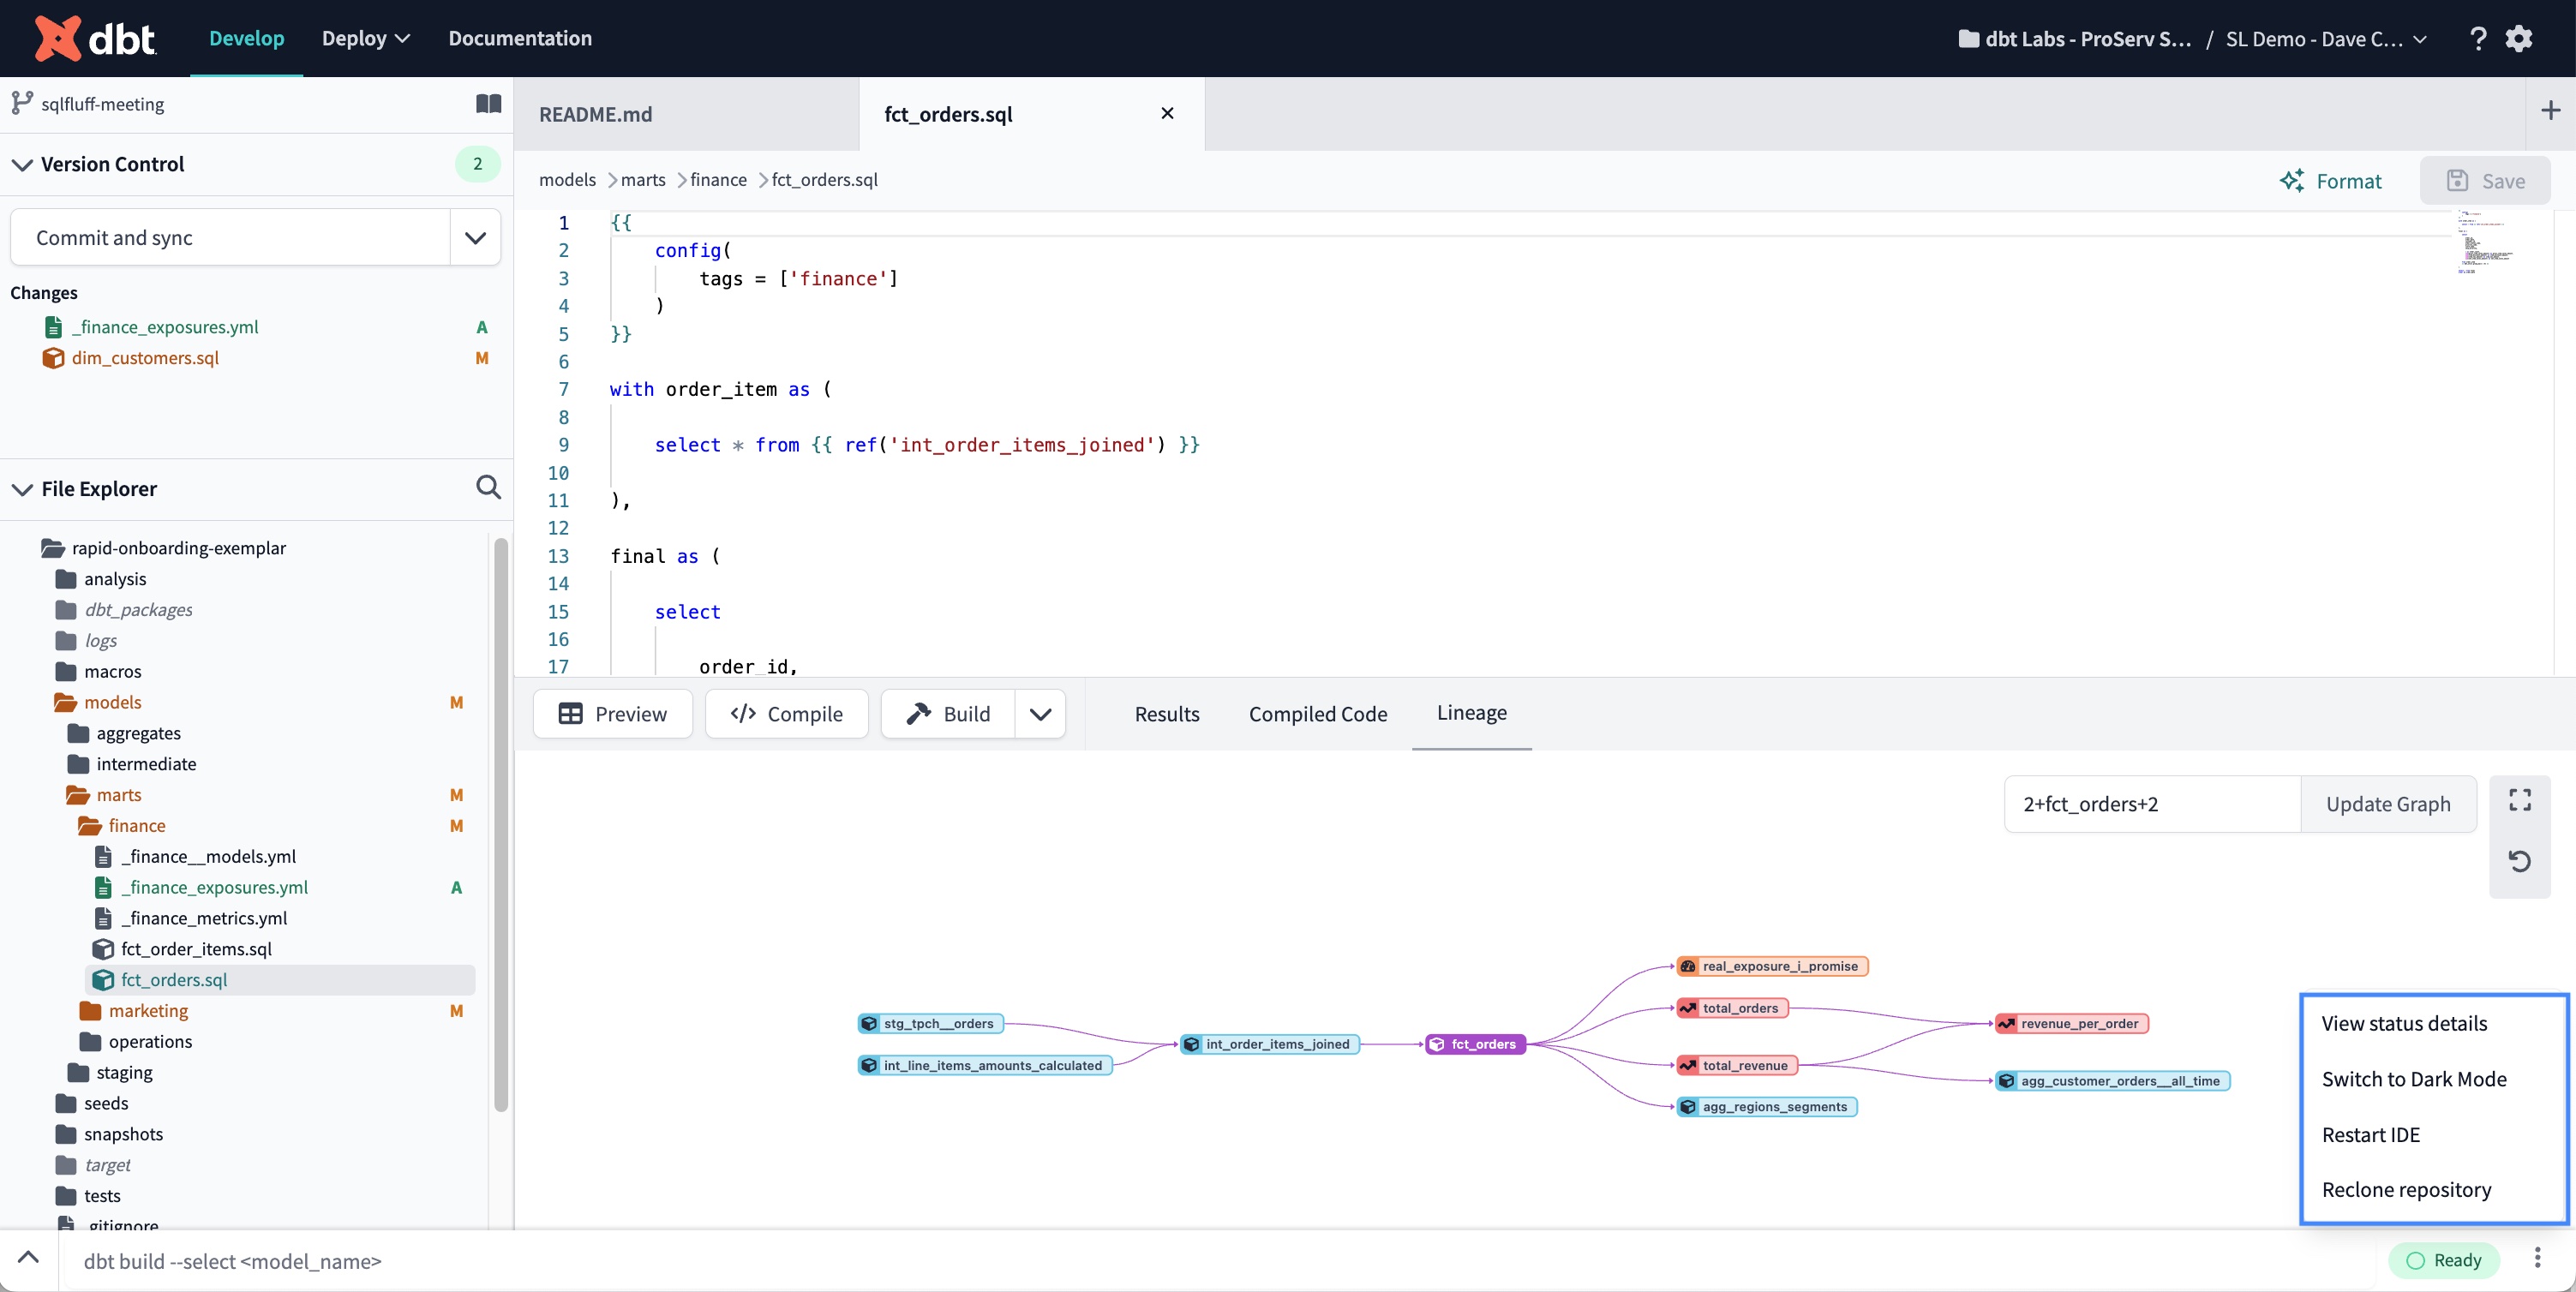
IDE user interface
The dbt Cloud IDE is a tool for developers to effortlessly build, test, run, and version-control their dbt projects, and enhance data governance — all from the convenience of your browser. Use the Cloud IDE to compile dbt code into SQL and run it against your database directly -- no command line required!
This page offers comprehensive definitions and terminology of user interface elements, allowing you to navigate the IDE landscape with ease.
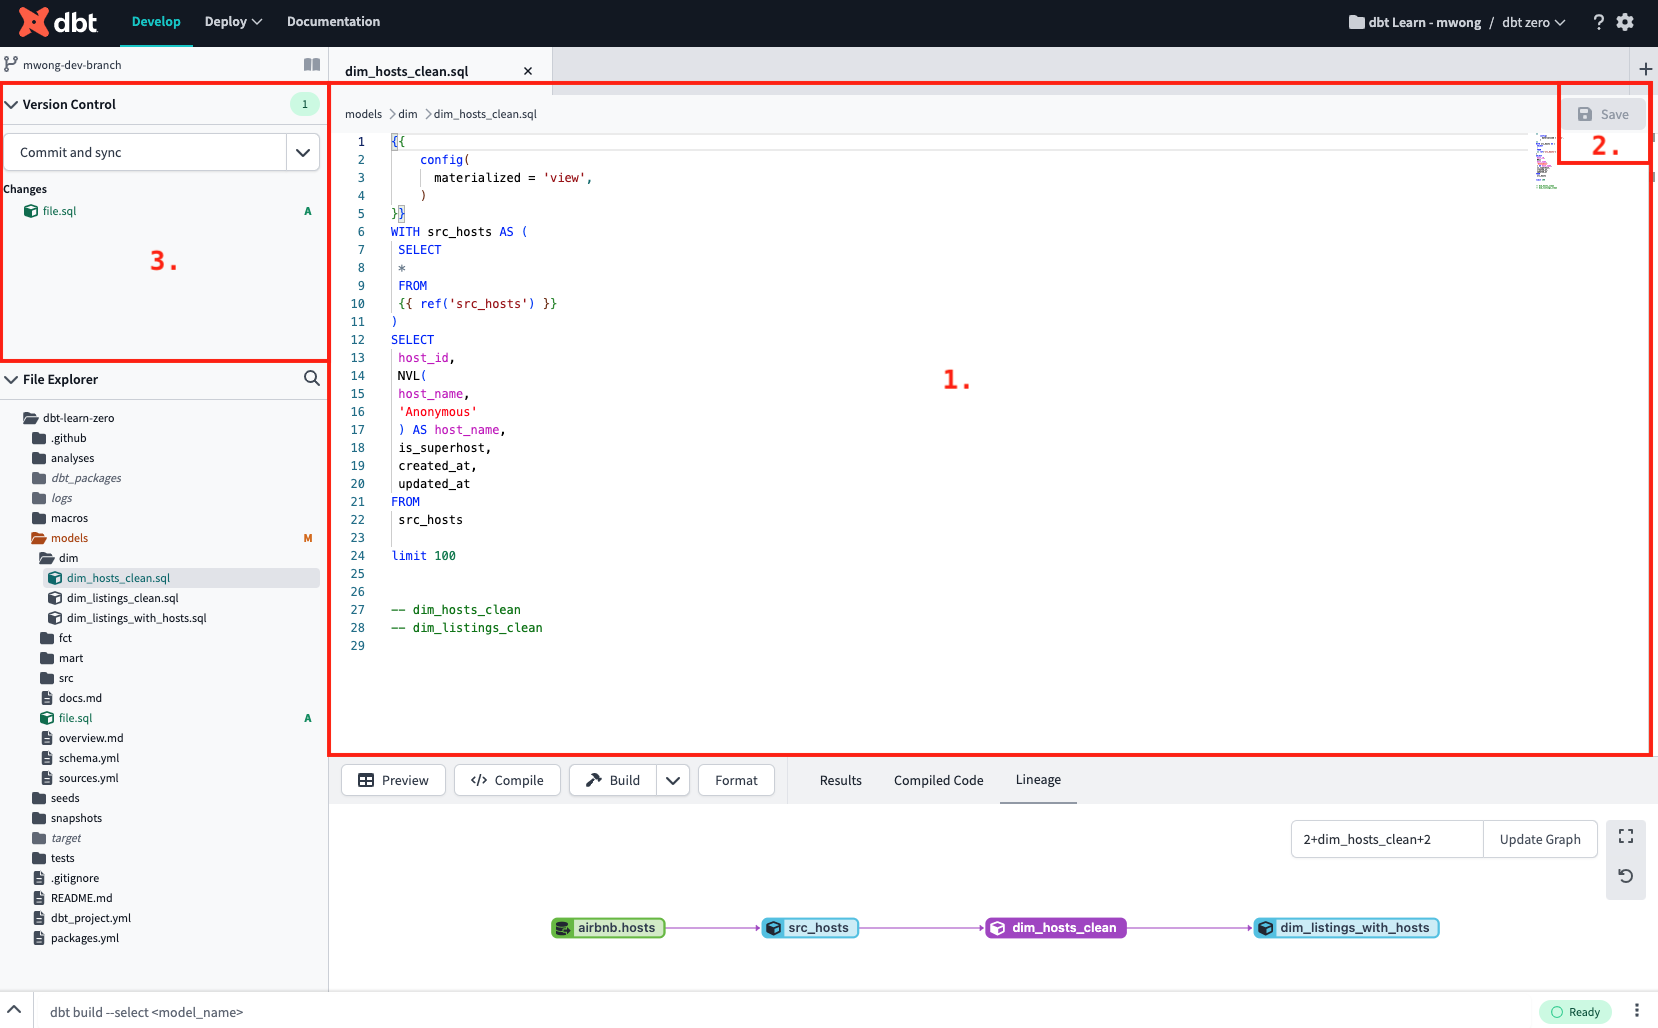
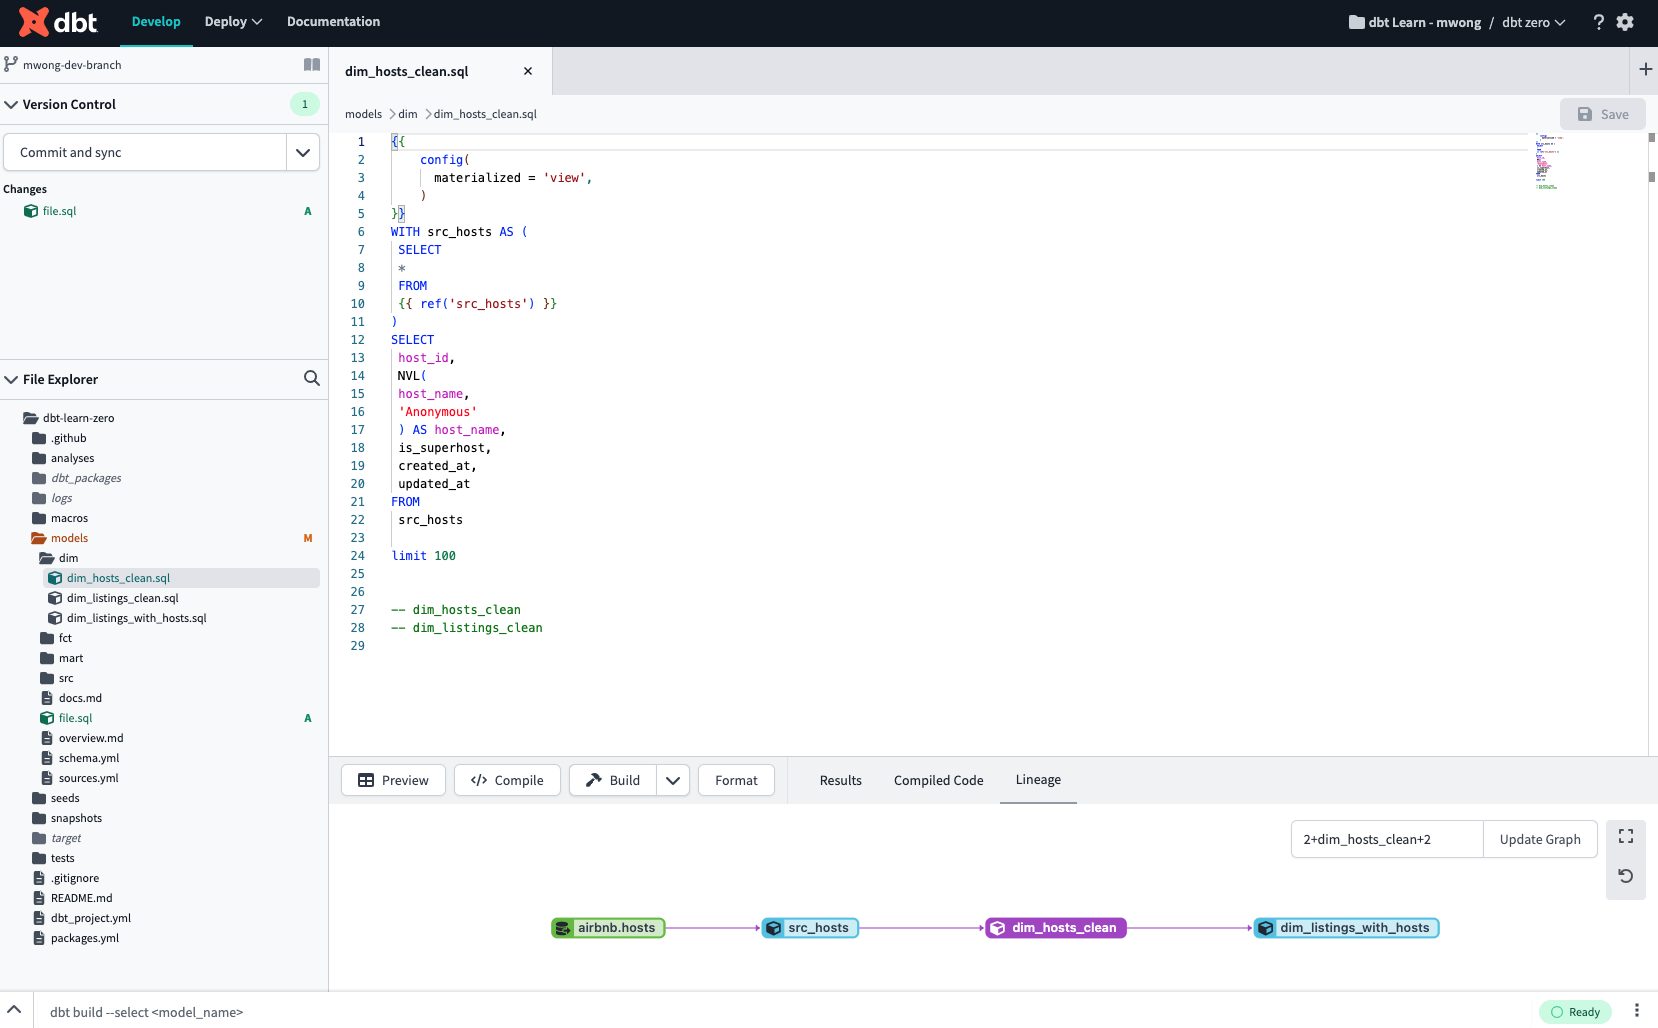 The Cloud IDE layout includes version control on the upper left, files/folders on the left, editor on the right an command/console at the bottom
Basic layout
The IDE streamlines your workflow, and features a popular user interface layout with files and folders on the left, editor on the right, and command and console information at the bottom.
-
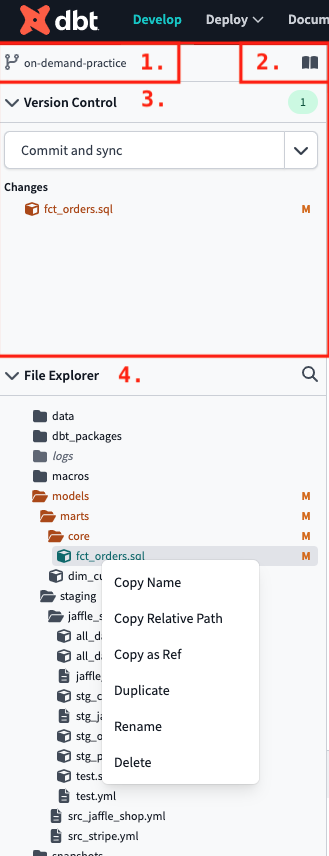
Git repository link — The Git repository link, located on the upper left of the IDE, takes you to your repository on the same active branch. It also displays the repository name and the active branch name.
- Note: This linking feature is only available for GitHub or GitLab repositories on multi-tenant dbt Cloud accounts.
-
Documentation site button — Clicking the Documentation site book icon, located next to the Git repository link, leads to the dbt Documentation site. The site is powered by the latest dbt artifacts generated in the IDE using the
dbt docs generatecommand from the Command bar. -
Version Control — The IDE's powerful Version Control section contains all git-related elements, including the Git actions button and the Changes section.
-
File Explorer — The File Explorer shows the filetree of your repository. You can:
- Click on any file in the filetree to open the file in the File Editor.
- Click and drag files between directories to move files.
- Right-click a file to access the sub-menu options like duplicate file, copy file name, copy as
ref, rename, delete. - Use file indicators, located to the right of your files or folder name, to see when changes or actions were made:
- Unsaved (•) — The IDE detects unsaved changes to your file/folder
- Modification (M) — The IDE detects a modification of existing files/folders
- Added (A) — The IDE detects added files
- Deleted (D) — The IDE detects deleted files.
-
Command bar — The Command bar, located in the lower left of the IDE, is used to invoke dbt commands. When a command is invoked, the associated logs are shown in the Invocation History Drawer.
-
Defer to production �— The Defer to production toggle allows developers to only build and run and test models they've edited without having to first run and build all the models that come before them (upstream parents). Refer to Using defer in dbt Cloud for more info.
-
Status button — The IDE Status button, located on the lower right of the IDE, displays the current IDE status. If there is an error in the status or in the dbt code that stops the project from parsing, the button will turn red and display "Error". If there aren't any errors, the button will display a green "Ready" status. To access the IDE Status modal, simply click on this button.
Editing features
The IDE features some delightful tools and layouts to make it easier for you to write dbt code and collaborate with teammates.
-
File Editor — The File Editor is where you edit code. Tabs break out the region for each opened file, and unsaved files are marked with a blue dot icon in the tab view. You can edit, format, or lint files and execute dbt commands in your protected primary git branch. Since the dbt Cloud IDE prevents commits to the protected branch, it prompts you to commit those changes to a new branch.
- Use intuitive keyboard shortcuts to help develop easier for you and your team.
-
Save button — The editor has a Save button that saves editable files. Pressing the button or using the Command-S or Control-S shortcut saves the file contents. You don't need to save to preview code results in the Console section, but it's necessary before changes appear in a dbt invocation. The File Editor tab shows a blue icon for unsaved changes.
-
Version Control — This menu contains all git-related elements, including the Git actions button. The button updates relevant actions based on your editor's state, such as prompting to pull remote changes, commit and sync when reverted commit changes are present, creating a merge/pull request when appropriate, or pruning branches deleted from the remote repository.
- The dropdown menu on the Git actions button allows users to revert changes, refresh Git state, create merge/pull requests, prune branches, and change branches.
- You can also resolve merge conflicts and for more info on git, refer to Version control basics.
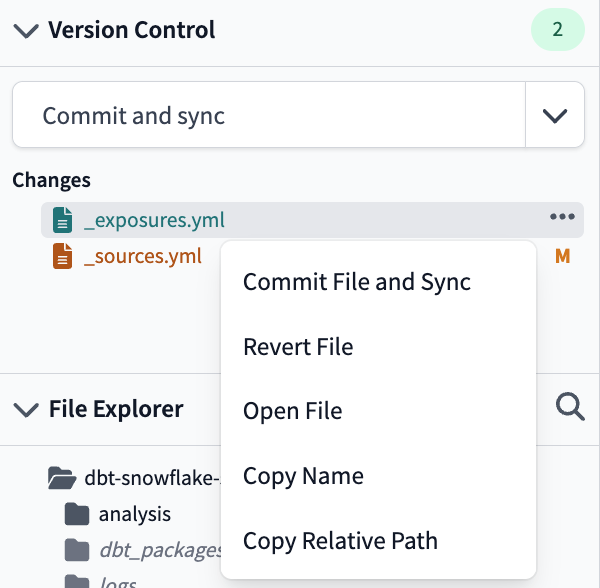
- Version Control Options menu — The Changes section, under the Git actions button, lists all file changes since the last commit. You can click on a change to open the Git Diff View to see the inline changes. You can also right-click any file and use the file-specific options in the Version Control Options menu.
- Use the Prune branches option to remove local branches that have already been deleted from the remote repository. Selecting this triggers a pop-up modal, where you can confirm the deletion of the specific local branches, keeping your branch management tidy. Note that this won't delete the branch you're currently on. Pruning branches isn't available for managed repositories because they don't have a typical remote setup, which prevents remote branch deletion.
Additional editing features
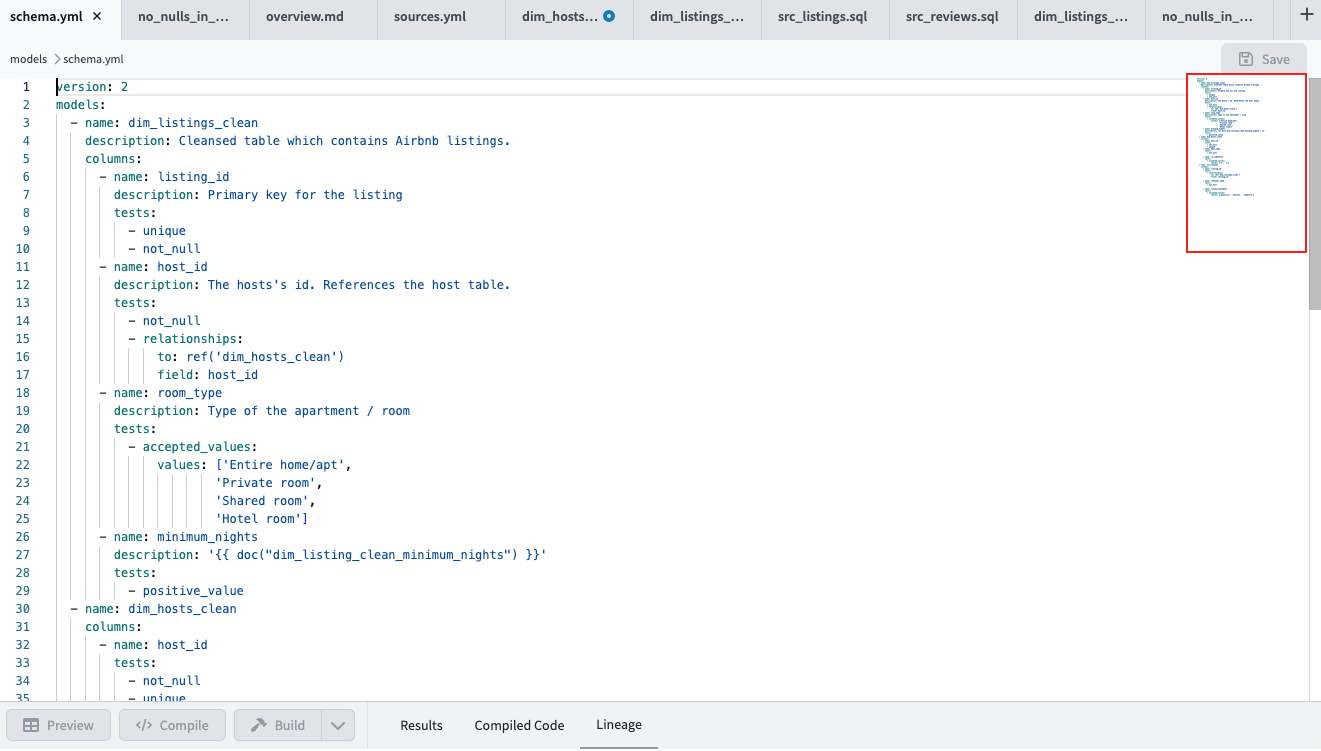
- Minimap — A Minimap (code outline) gives you a high-level overview of your source code, which is useful for quick navigation and code understanding. A file's minimap is displayed on the upper-right side of the editor. To quickly jump to different sections of your file, click the shaded area.
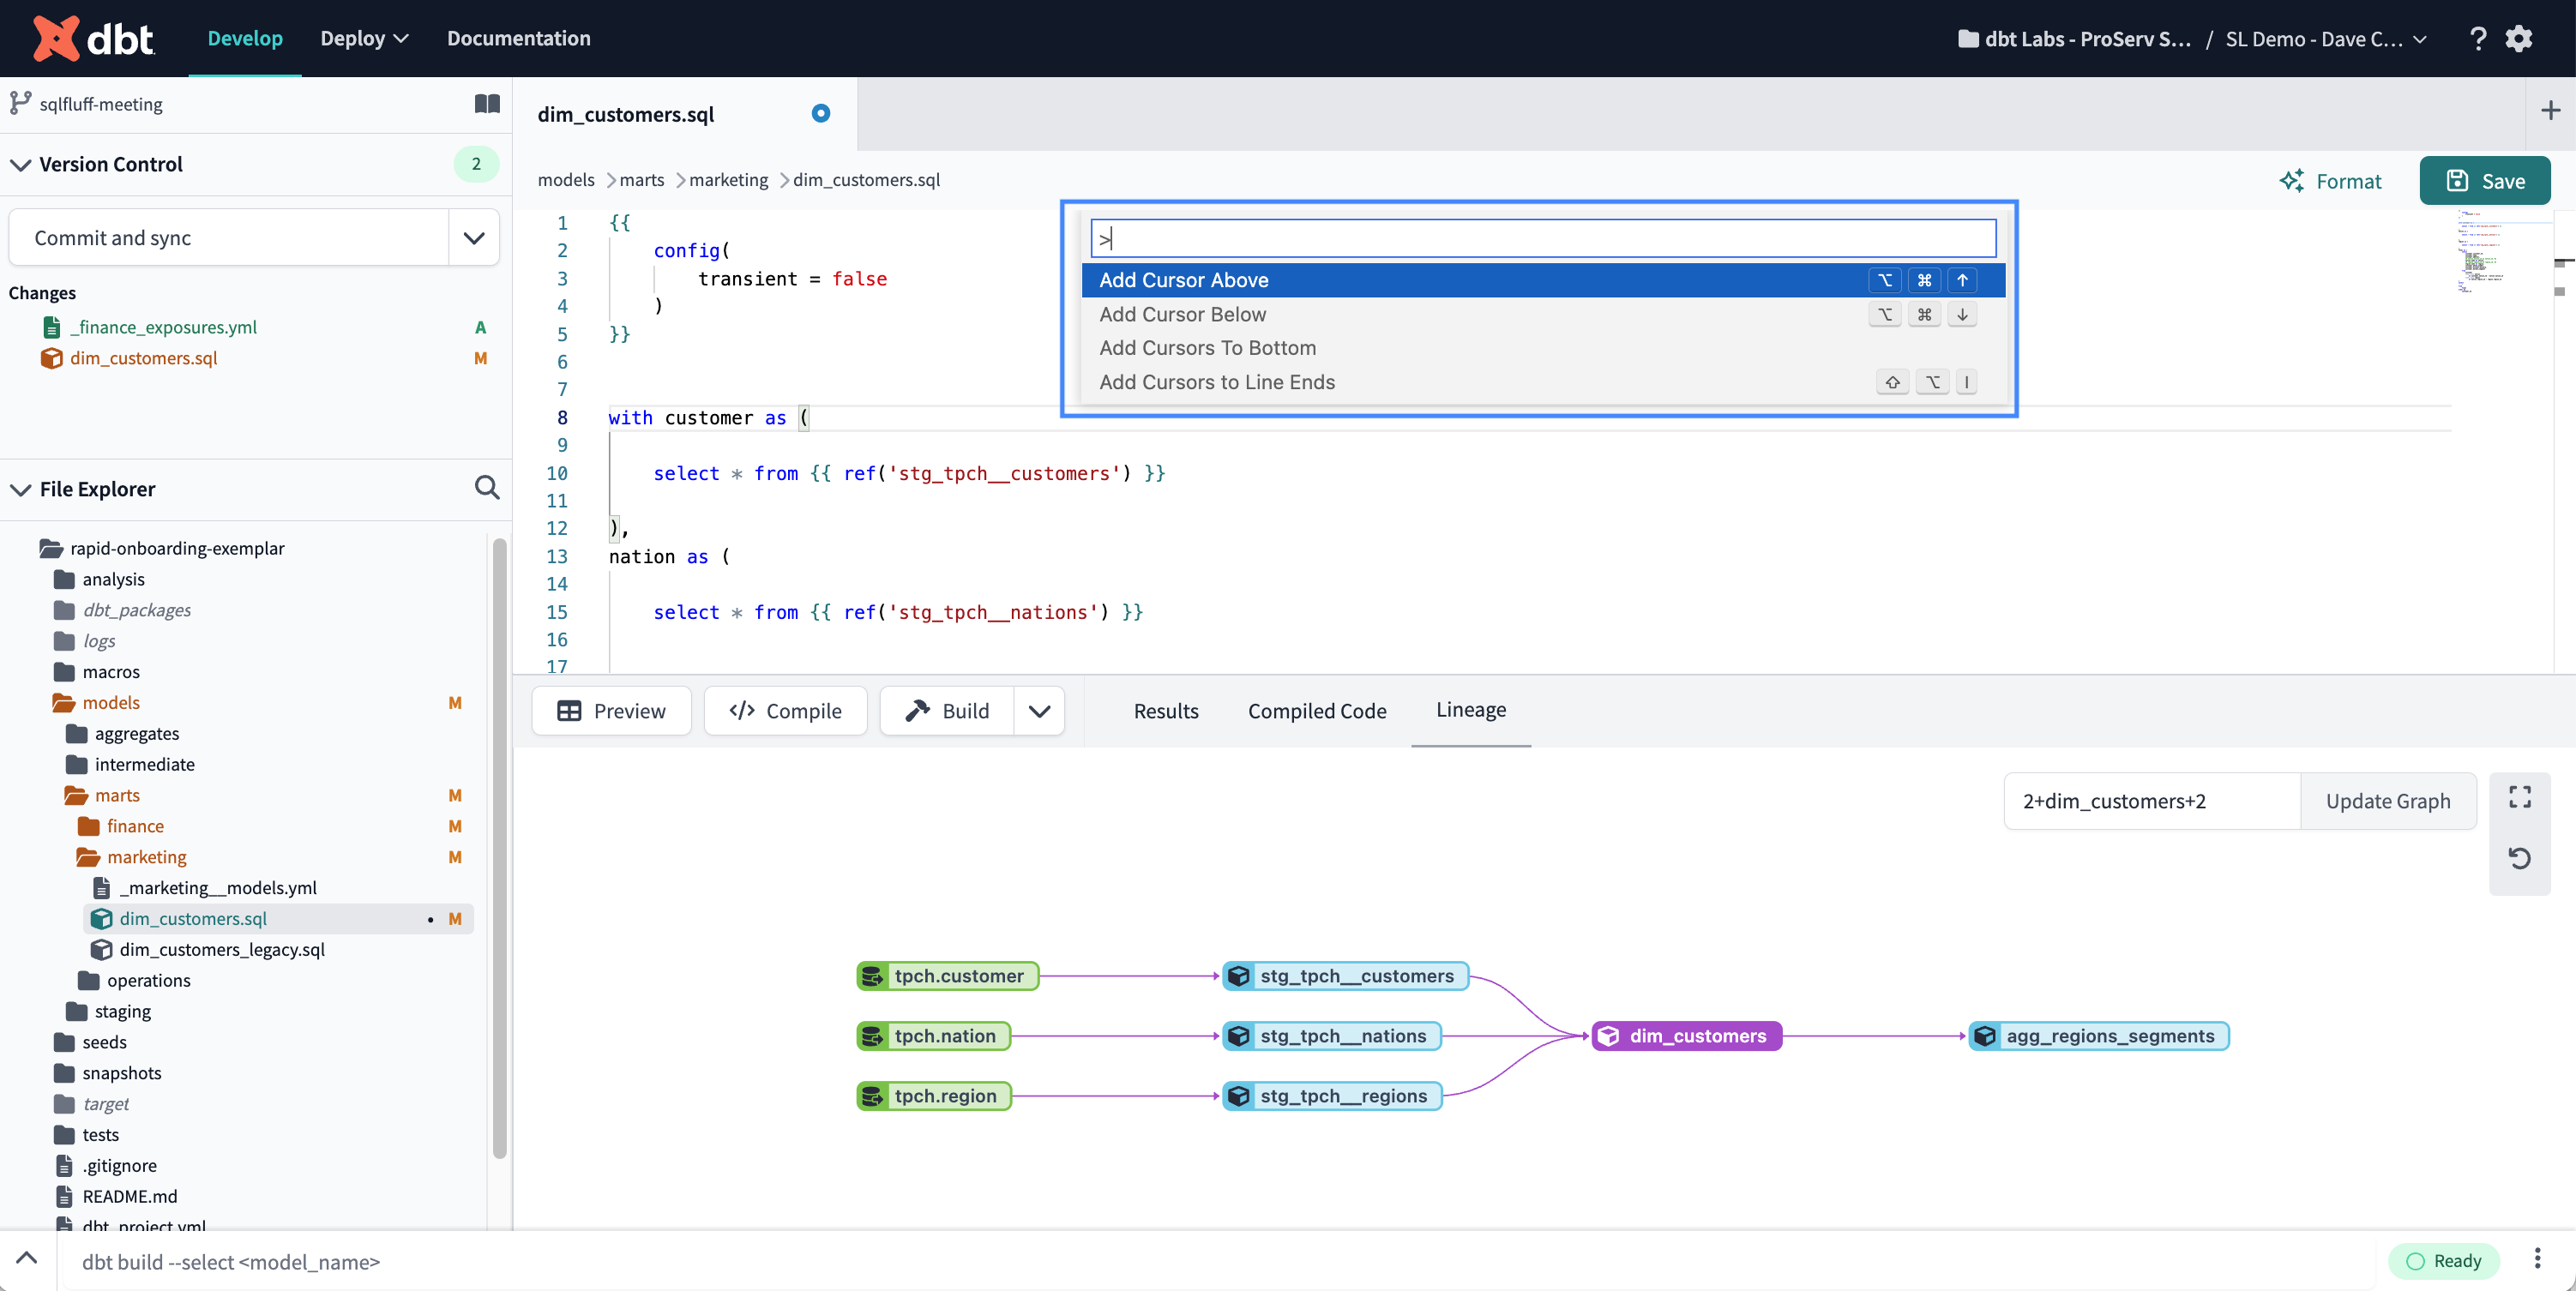
- dbt Editor Command Palette — The dbt Editor Command Palette displays text editing actions and their associated keyboard shortcuts. This can be accessed by pressing
F1or right-clicking in the text editing area and selecting Command Palette.
- Git Diff View — Clicking on a file in the Changes section of the Version Control Menu will open the changed file with Git Diff view. The editor will show the previous version on the left and the in-line changes made on the right.
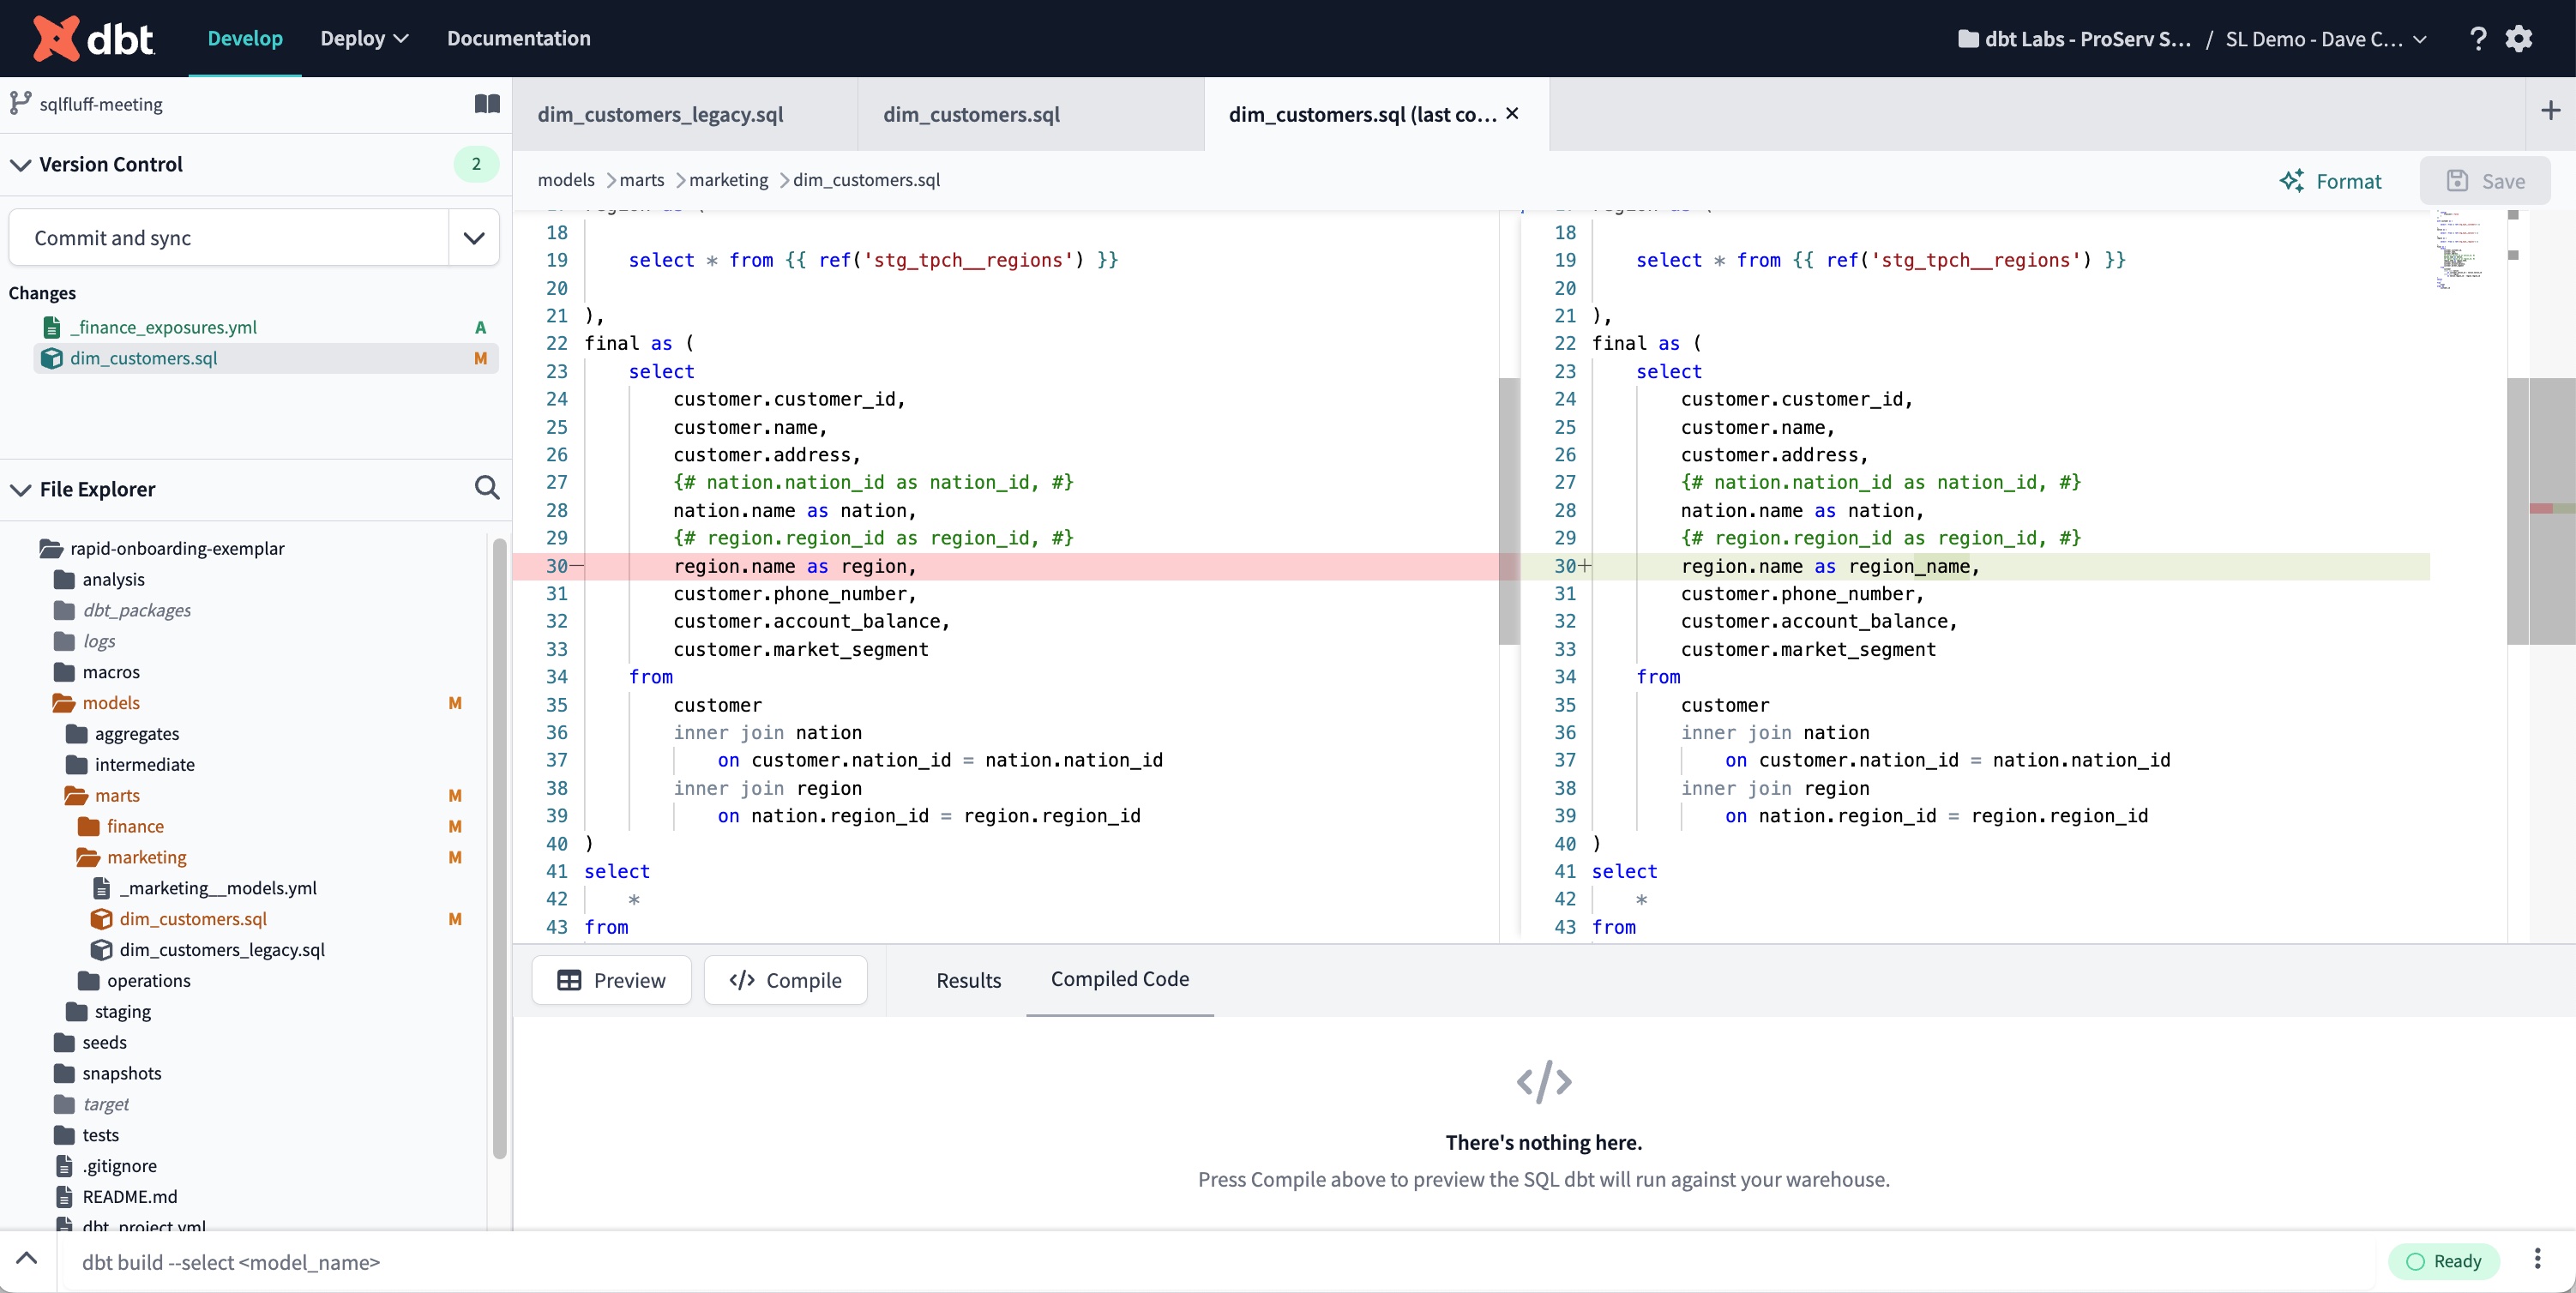 The Git Diff View displays the previous version on the left and the changes made on the right of the Editor
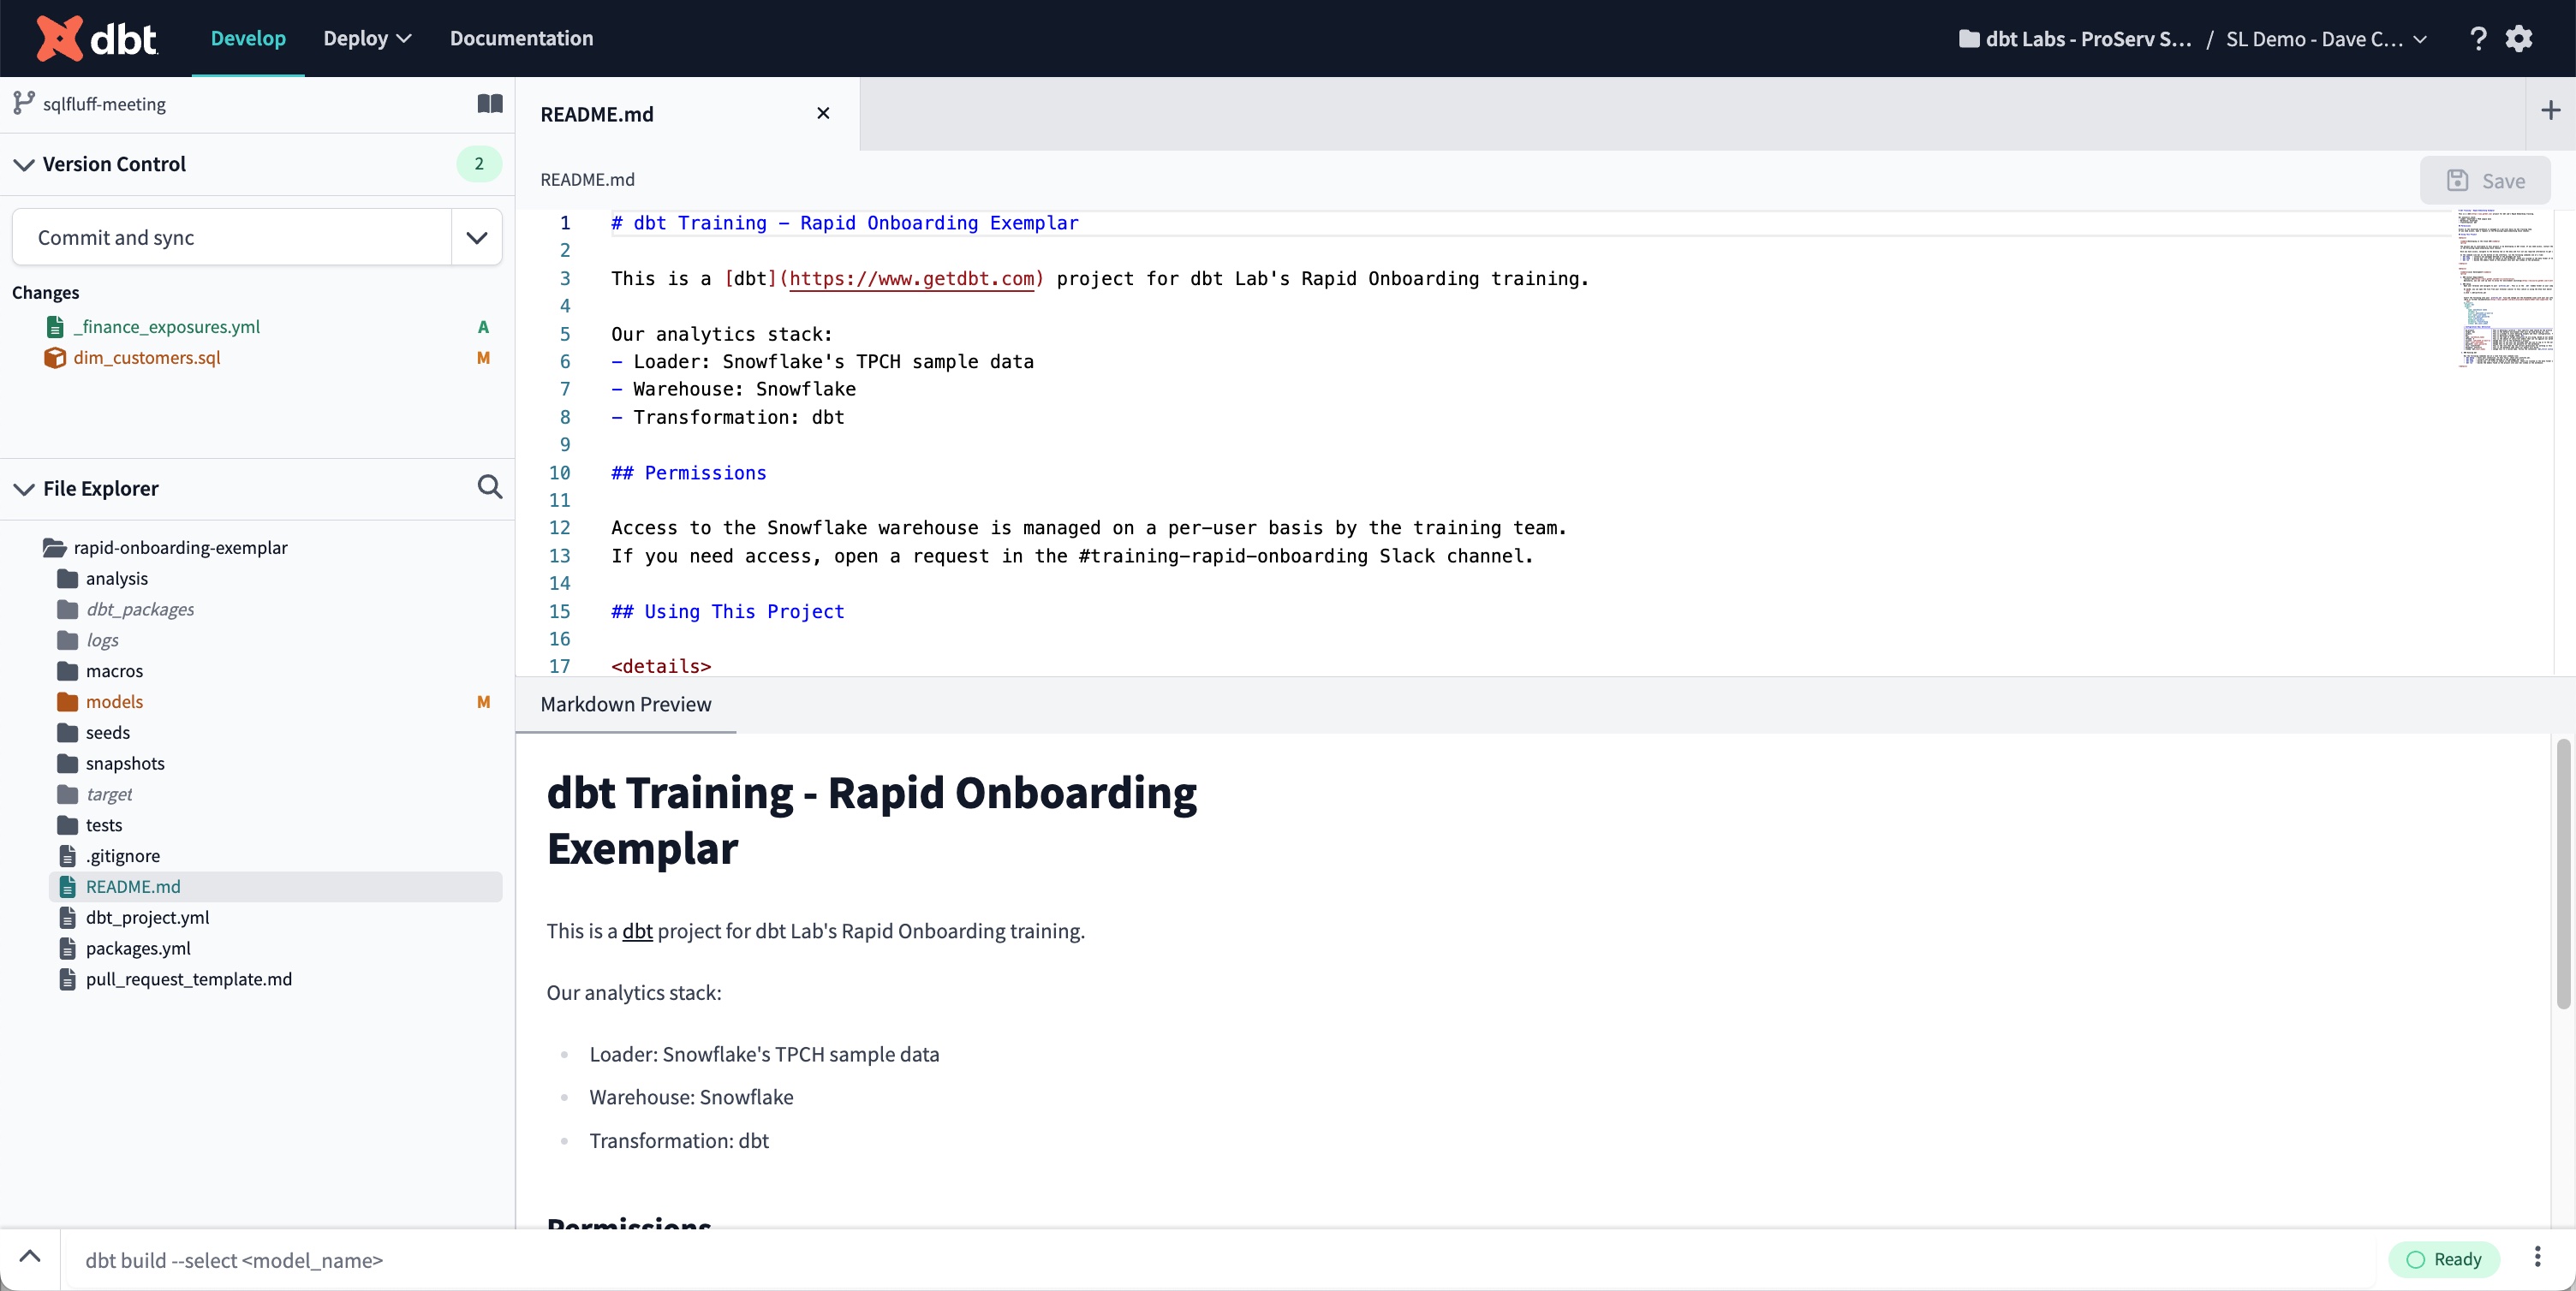
- Markdown Preview console tab — The Markdown Preview console tab shows a preview of your .md file's markdown code in your repository and updates it automatically as you edit your code.
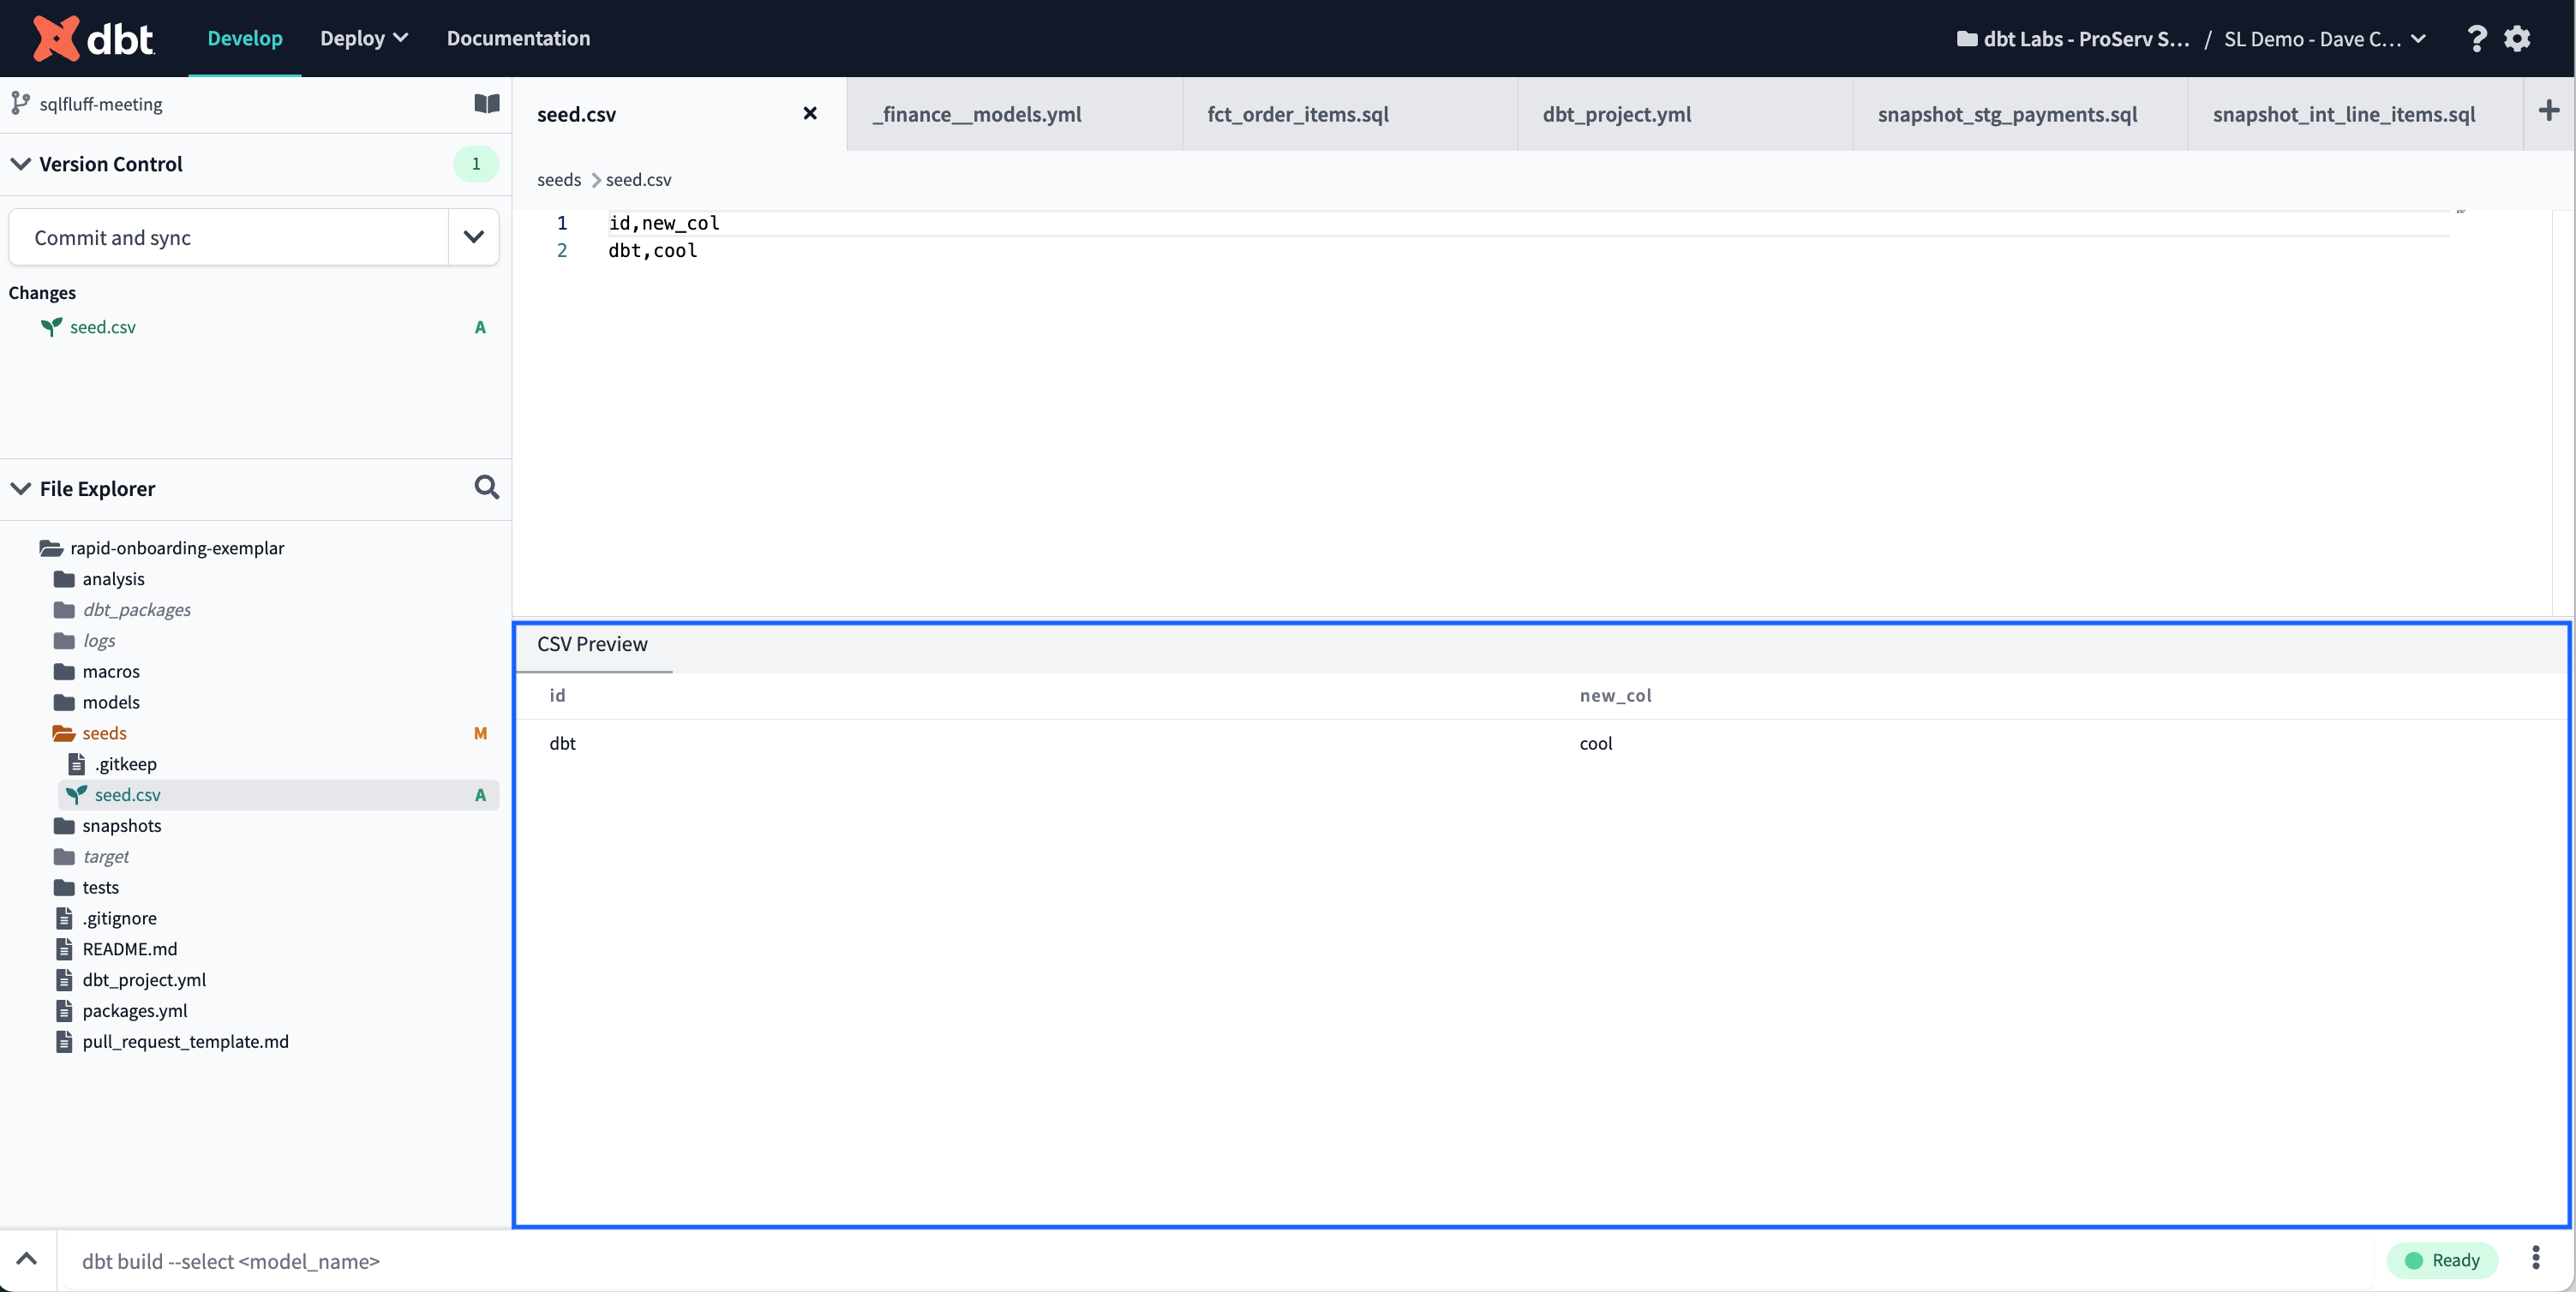
- CSV Preview console tab — The CSV Preview console tab displays the data from your CSV file in a table, which updates automatically as you edit the file in your seed directory.
Console section
The console section, located below the File editor, includes various console tabs and buttons to help you with tasks such as previewing, compiling, building, and viewing the DAG. Refer to the following sub-bullets for more details on the console tabs and buttons.
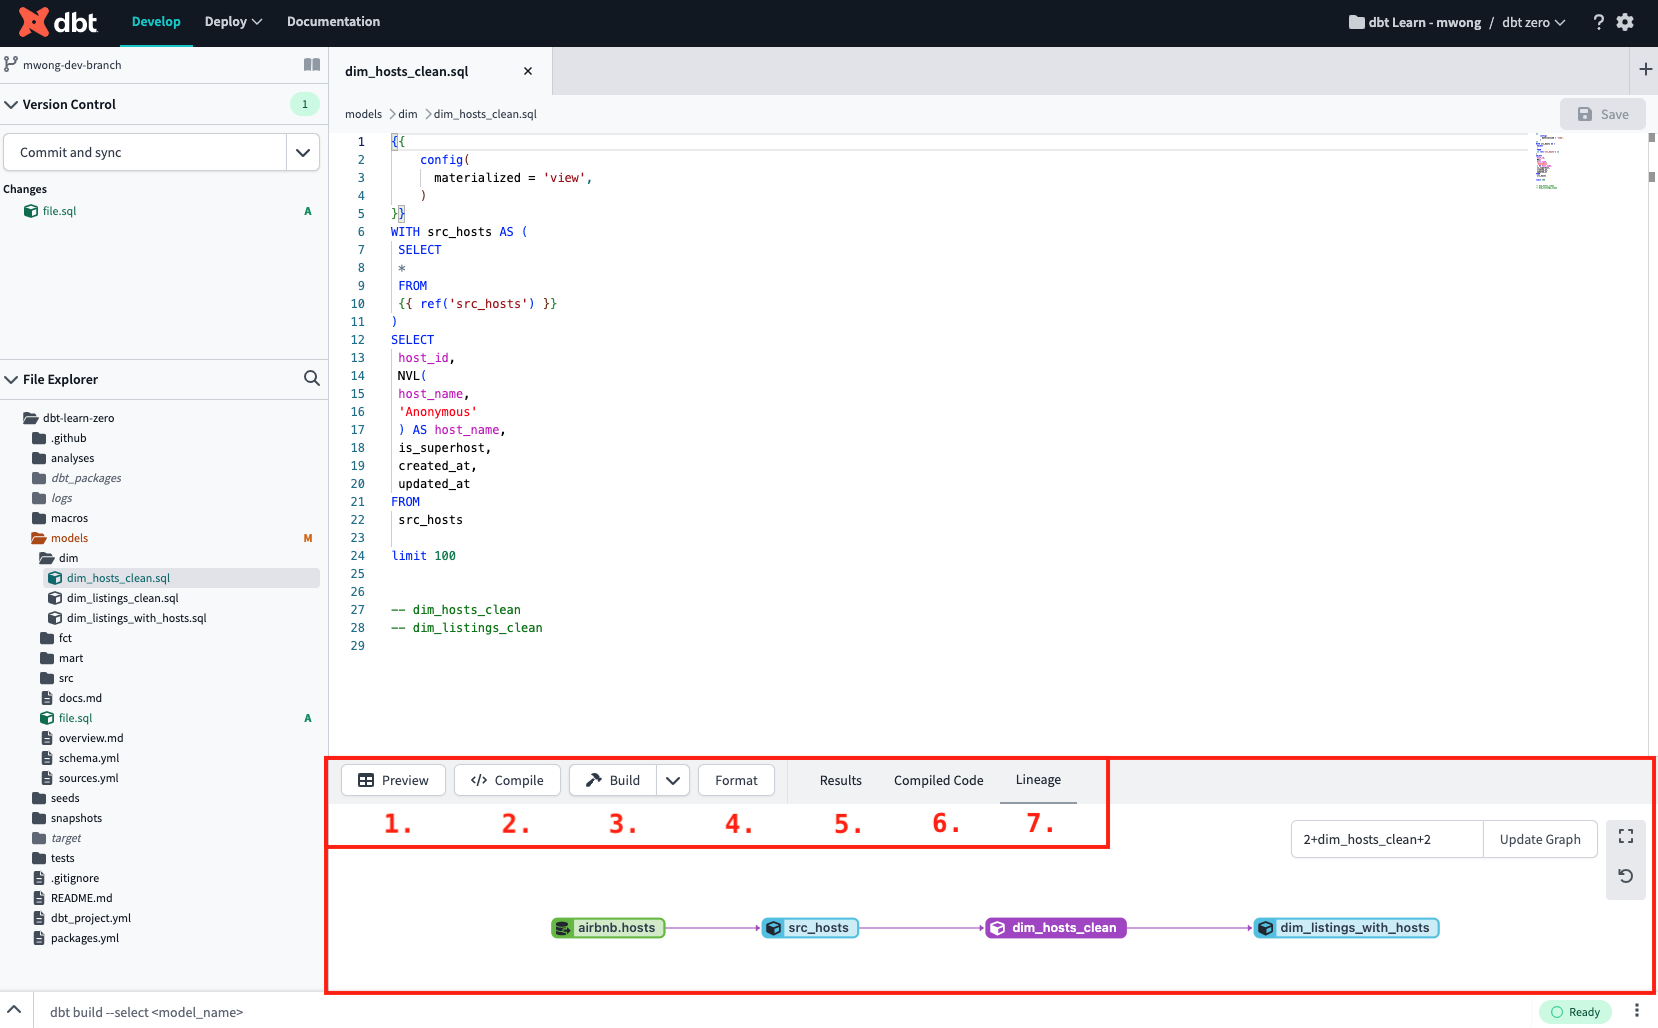 The Console section is located below the File editor and has various tabs and buttons to help execute tasks
- Preview button — When you click on the Preview button, it runs the SQL in the active file editor regardless of whether you have saved it or not and sends the results to the Results console tab. You can preview a selected portion of saved or unsaved code by highlighting it and then clicking the Preview button.
Details
Row limits in IDE
The dbt Cloud IDE returns default row limits, however, you can also specify the number of records returned. Refer to the following sub-bullets for more info:- 500-row limit: To prevent the IDE from returning too much data and causing browser problems, dbt automatically sets a 500-row limit when using the Preview Button. You can modify this by adding
limit your_numberat the end of your SQL statement. For example,SELECT * FROMtablelimit 100will return up to 100 rows. Remember that you must write thelimit your_numberexplicitly and cannot derive it from a macro. - Change row limit default: In dbt version 1.6 or higher, you can change the default limit of 500 rows shown in the Results tab when you run a query. To adjust the setting you can click on Change row display next to the displayed rows. Keep in mind that you can't set it higher than 10,000 rows. If you refresh the page or close your development session, the default limit will go back to 500 rows.
- Specify records returned: The IDE also supports
SELECT TOP #, which specifies the number of records to return.
- Compile button — The Compile button compiles the saved or unsaved SQL code and displays it in the Compiled Code tab.
Starting from dbt v1.6 or higher, when you save changes to a model, you can compile its code with the model's specific context. This context is similar to what you'd have when building the model and involves useful context variables like {{ this }} or {{ is_incremental() }}.
-
Build button — The build button allows users to quickly access dbt commands related to the active model in the File Editor. The available commands include dbt build, dbt test, and dbt run, with options to include only the current resource, the resource and its upstream dependencies, the resource, and its downstream dependencies, or the resource with all dependencies. This menu is available for all executable nodes.
-
Format button — The editor has a Format button that can reformat the contents of your files. For SQL files, it uses either
sqlfmtorsqlfluff, and for Python files, it usesblack. -
Results tab — The Results console tab displays the most recent Preview results in tabular format.
- Compiled Code tab — The Compile button triggers a compile invocation that generates compiled code, which is displayed in the Compiled Code tab.
- Lineage tab — The Lineage tab in the File Editor displays the active model's lineage or DAG. By default, it shows two degrees of lineage in both directions (
2+model_name+2), however, you can change it to +model+ (full DAG).- Double-click a node in the DAG to open that file in a new tab
- Expand or shrink the DAG using node selection syntax.
- Note, the
--excludeflag isn't supported.
Invocation history
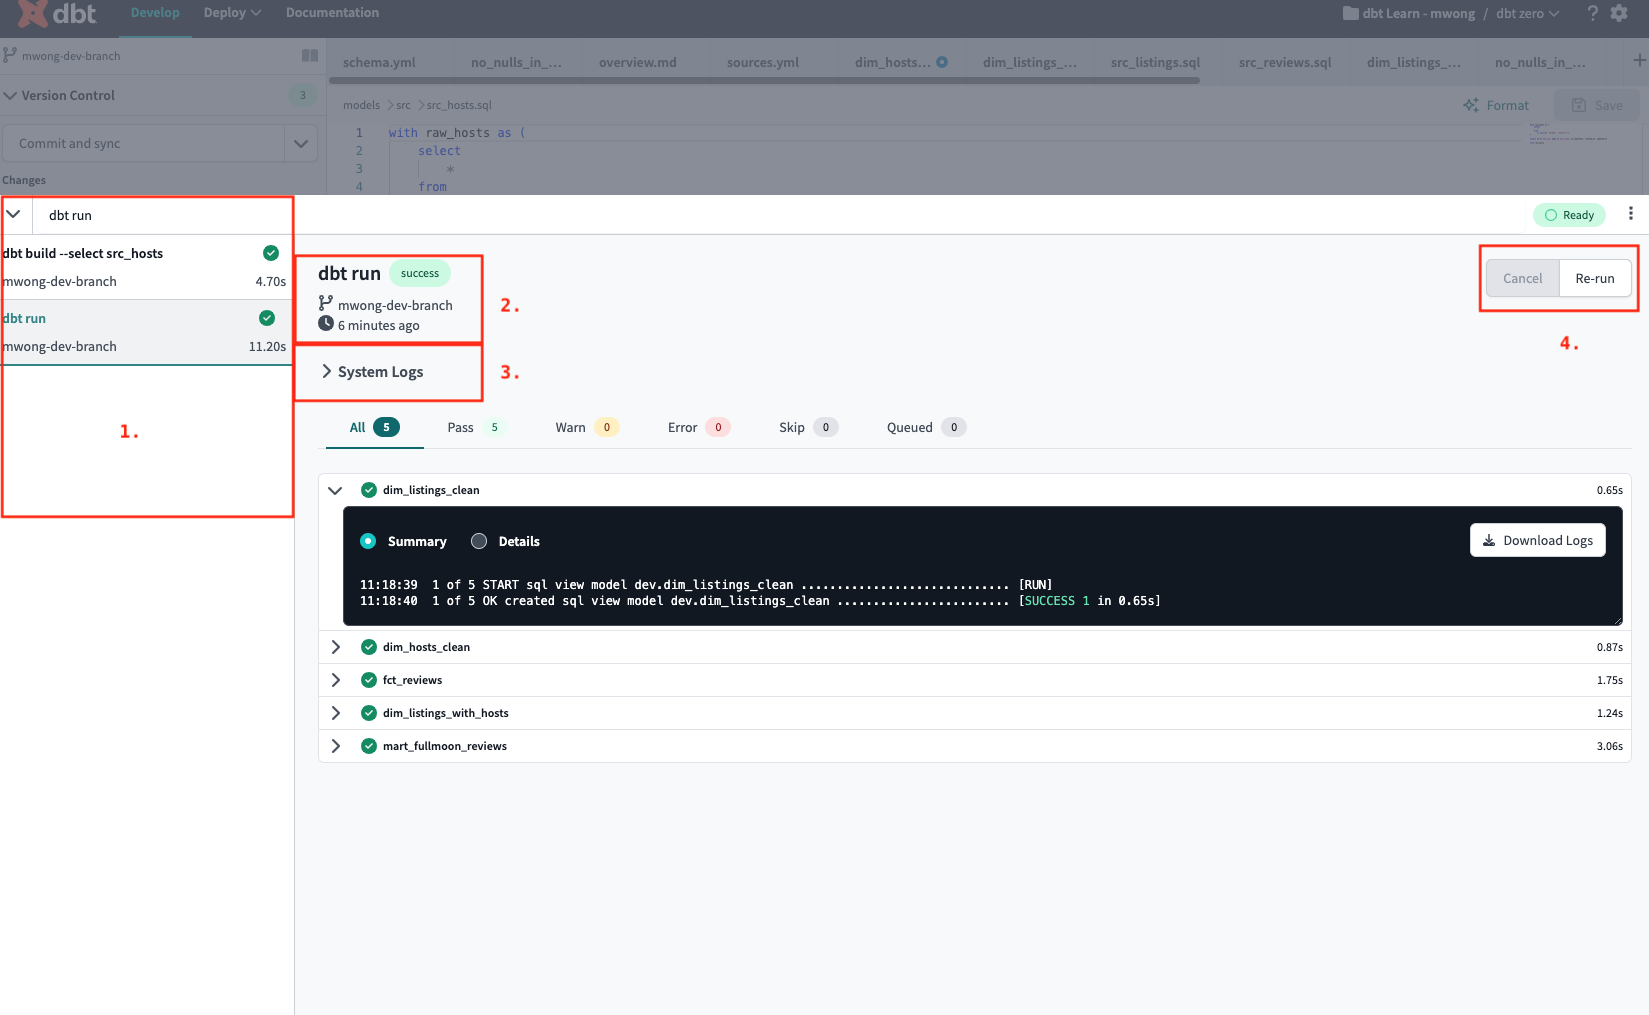
The Invocation History Drawer stores information on dbt invocations in the IDE. When you invoke a command, like executing a dbt command such as dbt run, the associated logs are displayed in the Invocation History Drawer.
You can open the drawer in multiple ways:
- Clicking the
^icon next to the Command bar on the lower left of the page - Typing a dbt command and pressing enter
- Or pressing Control-backtick (or Ctrl + `)
-
Invocation History list — The left-hand panel of the Invocation History Drawer displays a list of previous invocations in the IDE, including the command, branch name, command status, and elapsed time.
-
Invocation Summary — The Invocation Summary, located above System Logs, displays information about a selected command from the Invocation History list, such as the command, its status (
Runningif it's still running), the git branch that was active during the command, and the time the command was invoked. -
System Logs toggle — The System Logs toggle, located under the Invocation Summary, allows the user to see the full stdout and debug logs for the entirety of the invoked command.
-
Command Control button — Use the Command Control button, located on the right side, to control your invocation and cancel or rerun a selected run.
-
Node Summary tab — Clicking on the Results Status Tabs will filter the Node Status List based on their corresponding status. The available statuses are Pass (successful invocation of a node), Warn (test executed with a warning), Error (database error or test failure), Skip (nodes not run due to upstream error), and Queued (nodes that have not executed yet).
-
Node result toggle — After running a dbt command, information about each executed node can be found in a Node Result toggle, which includes a summary and debug logs. The Node Results List lists every node that was invoked during the command.
-
Node result list — The Node result list shows all the Node Results used in the dbt run, and you can filter it by clicking on a Result Status tab.
Modals and Menus
Use menus and modals to interact with IDE and access useful options to help your development workflow.
-
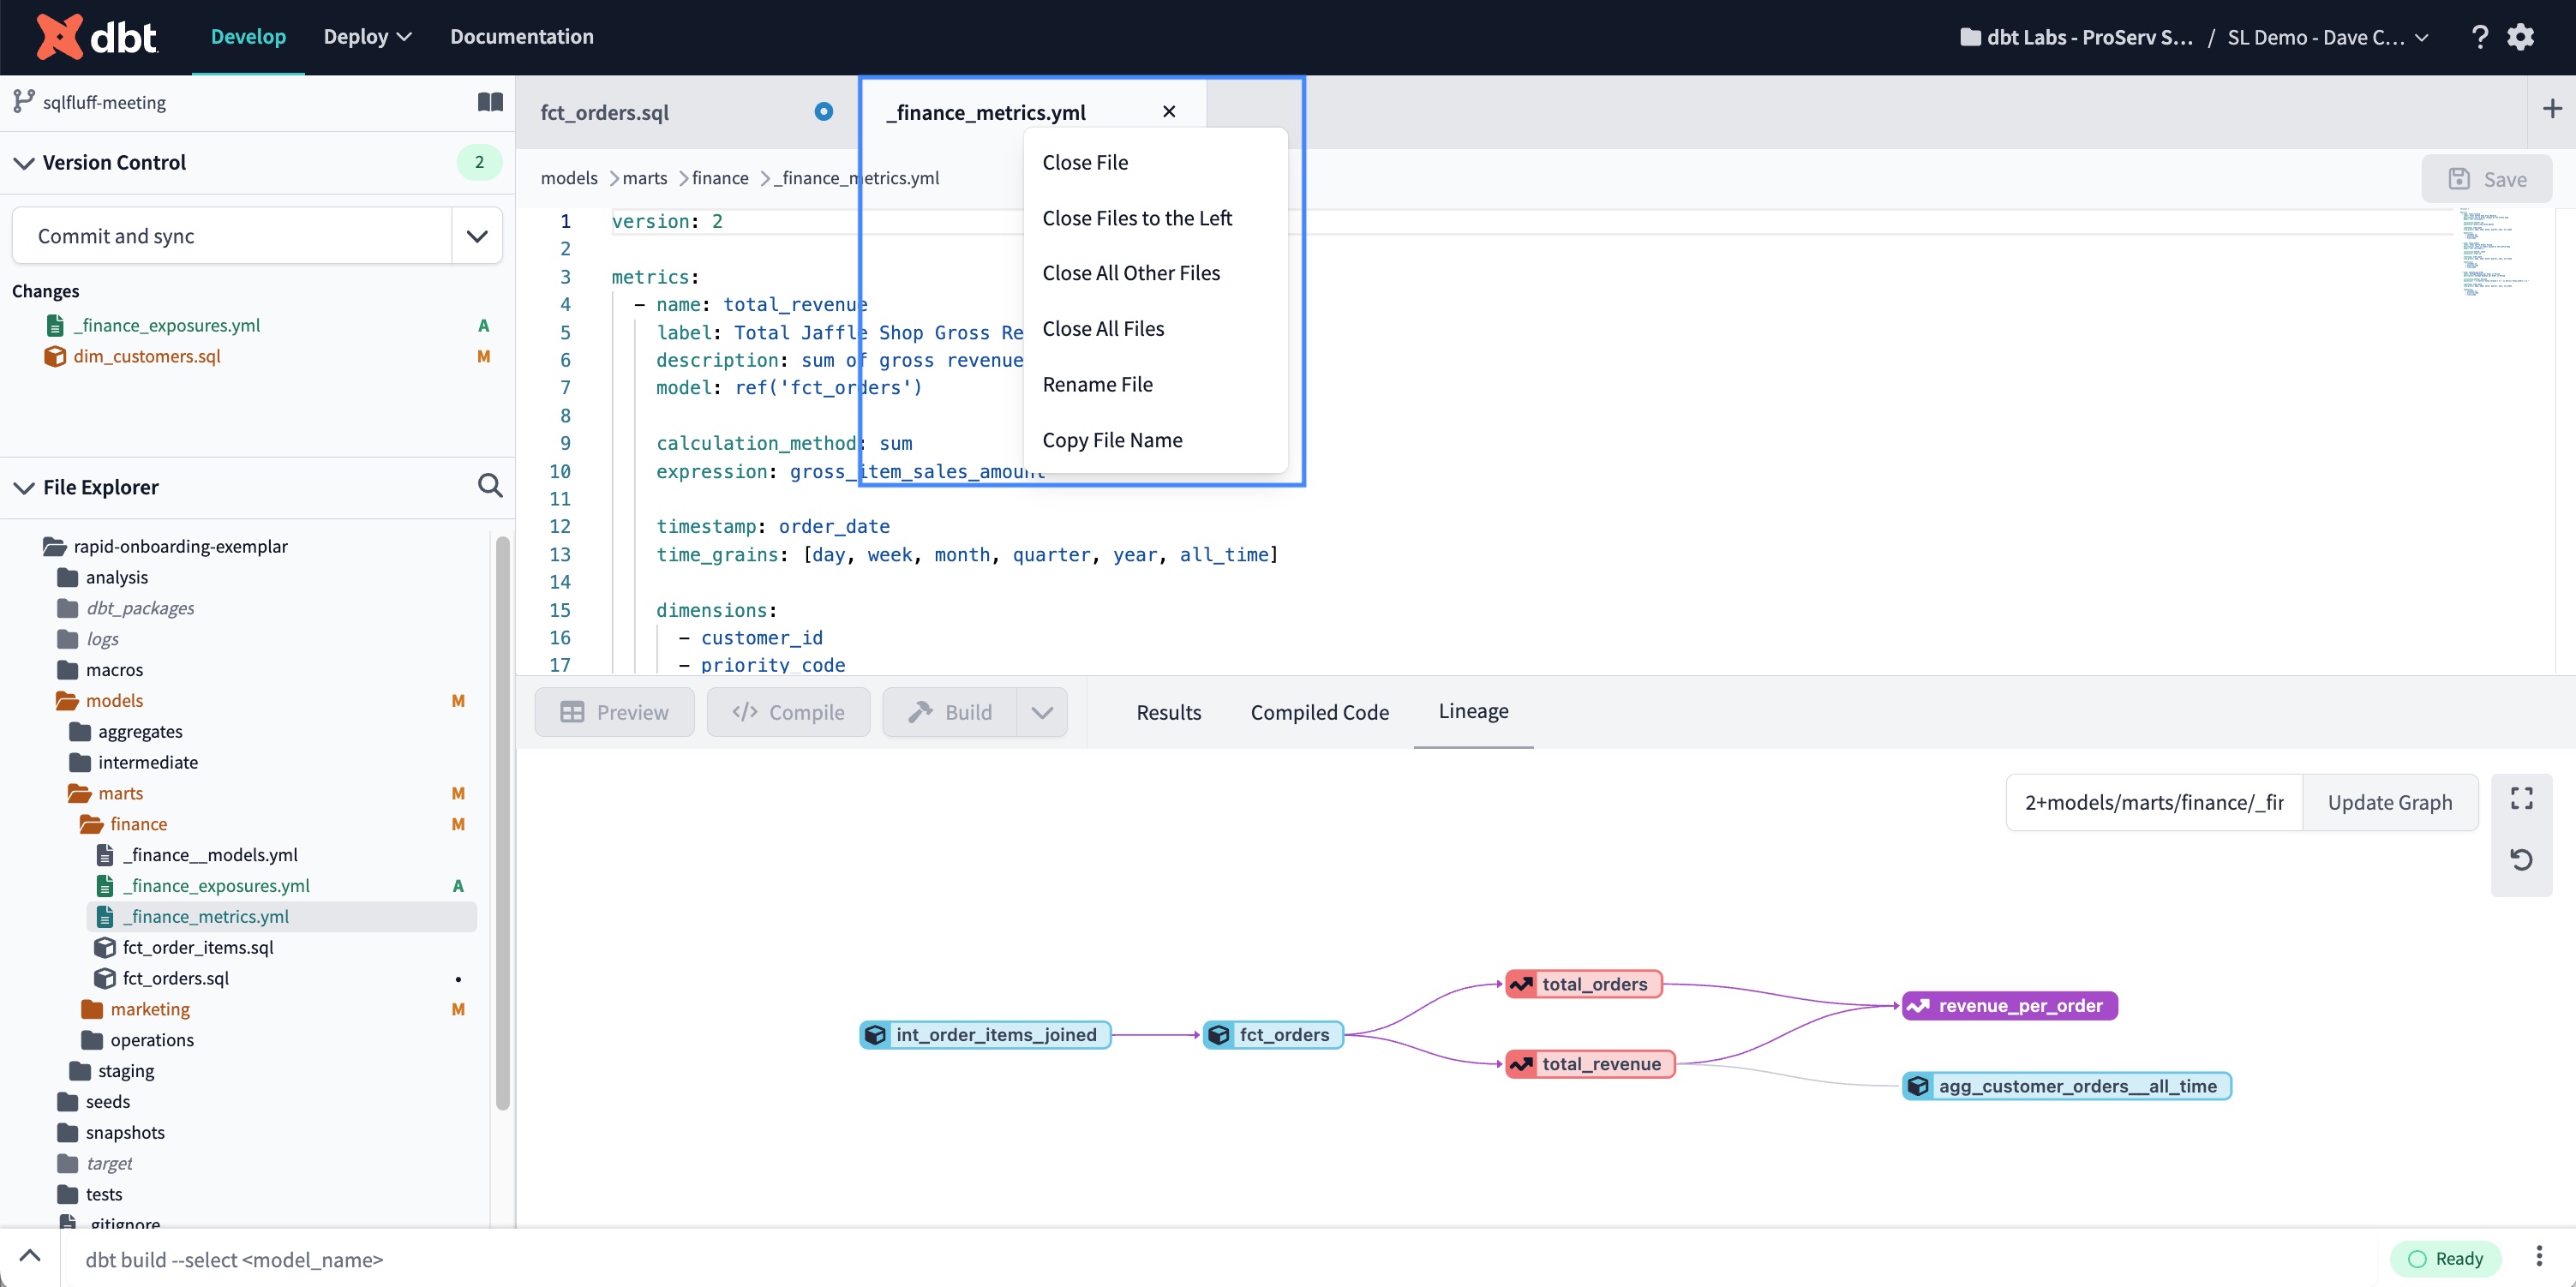
Editor tab menu
To interact with open editor tabs, right-click any tab to access the helpful options in the file tab menu.
-
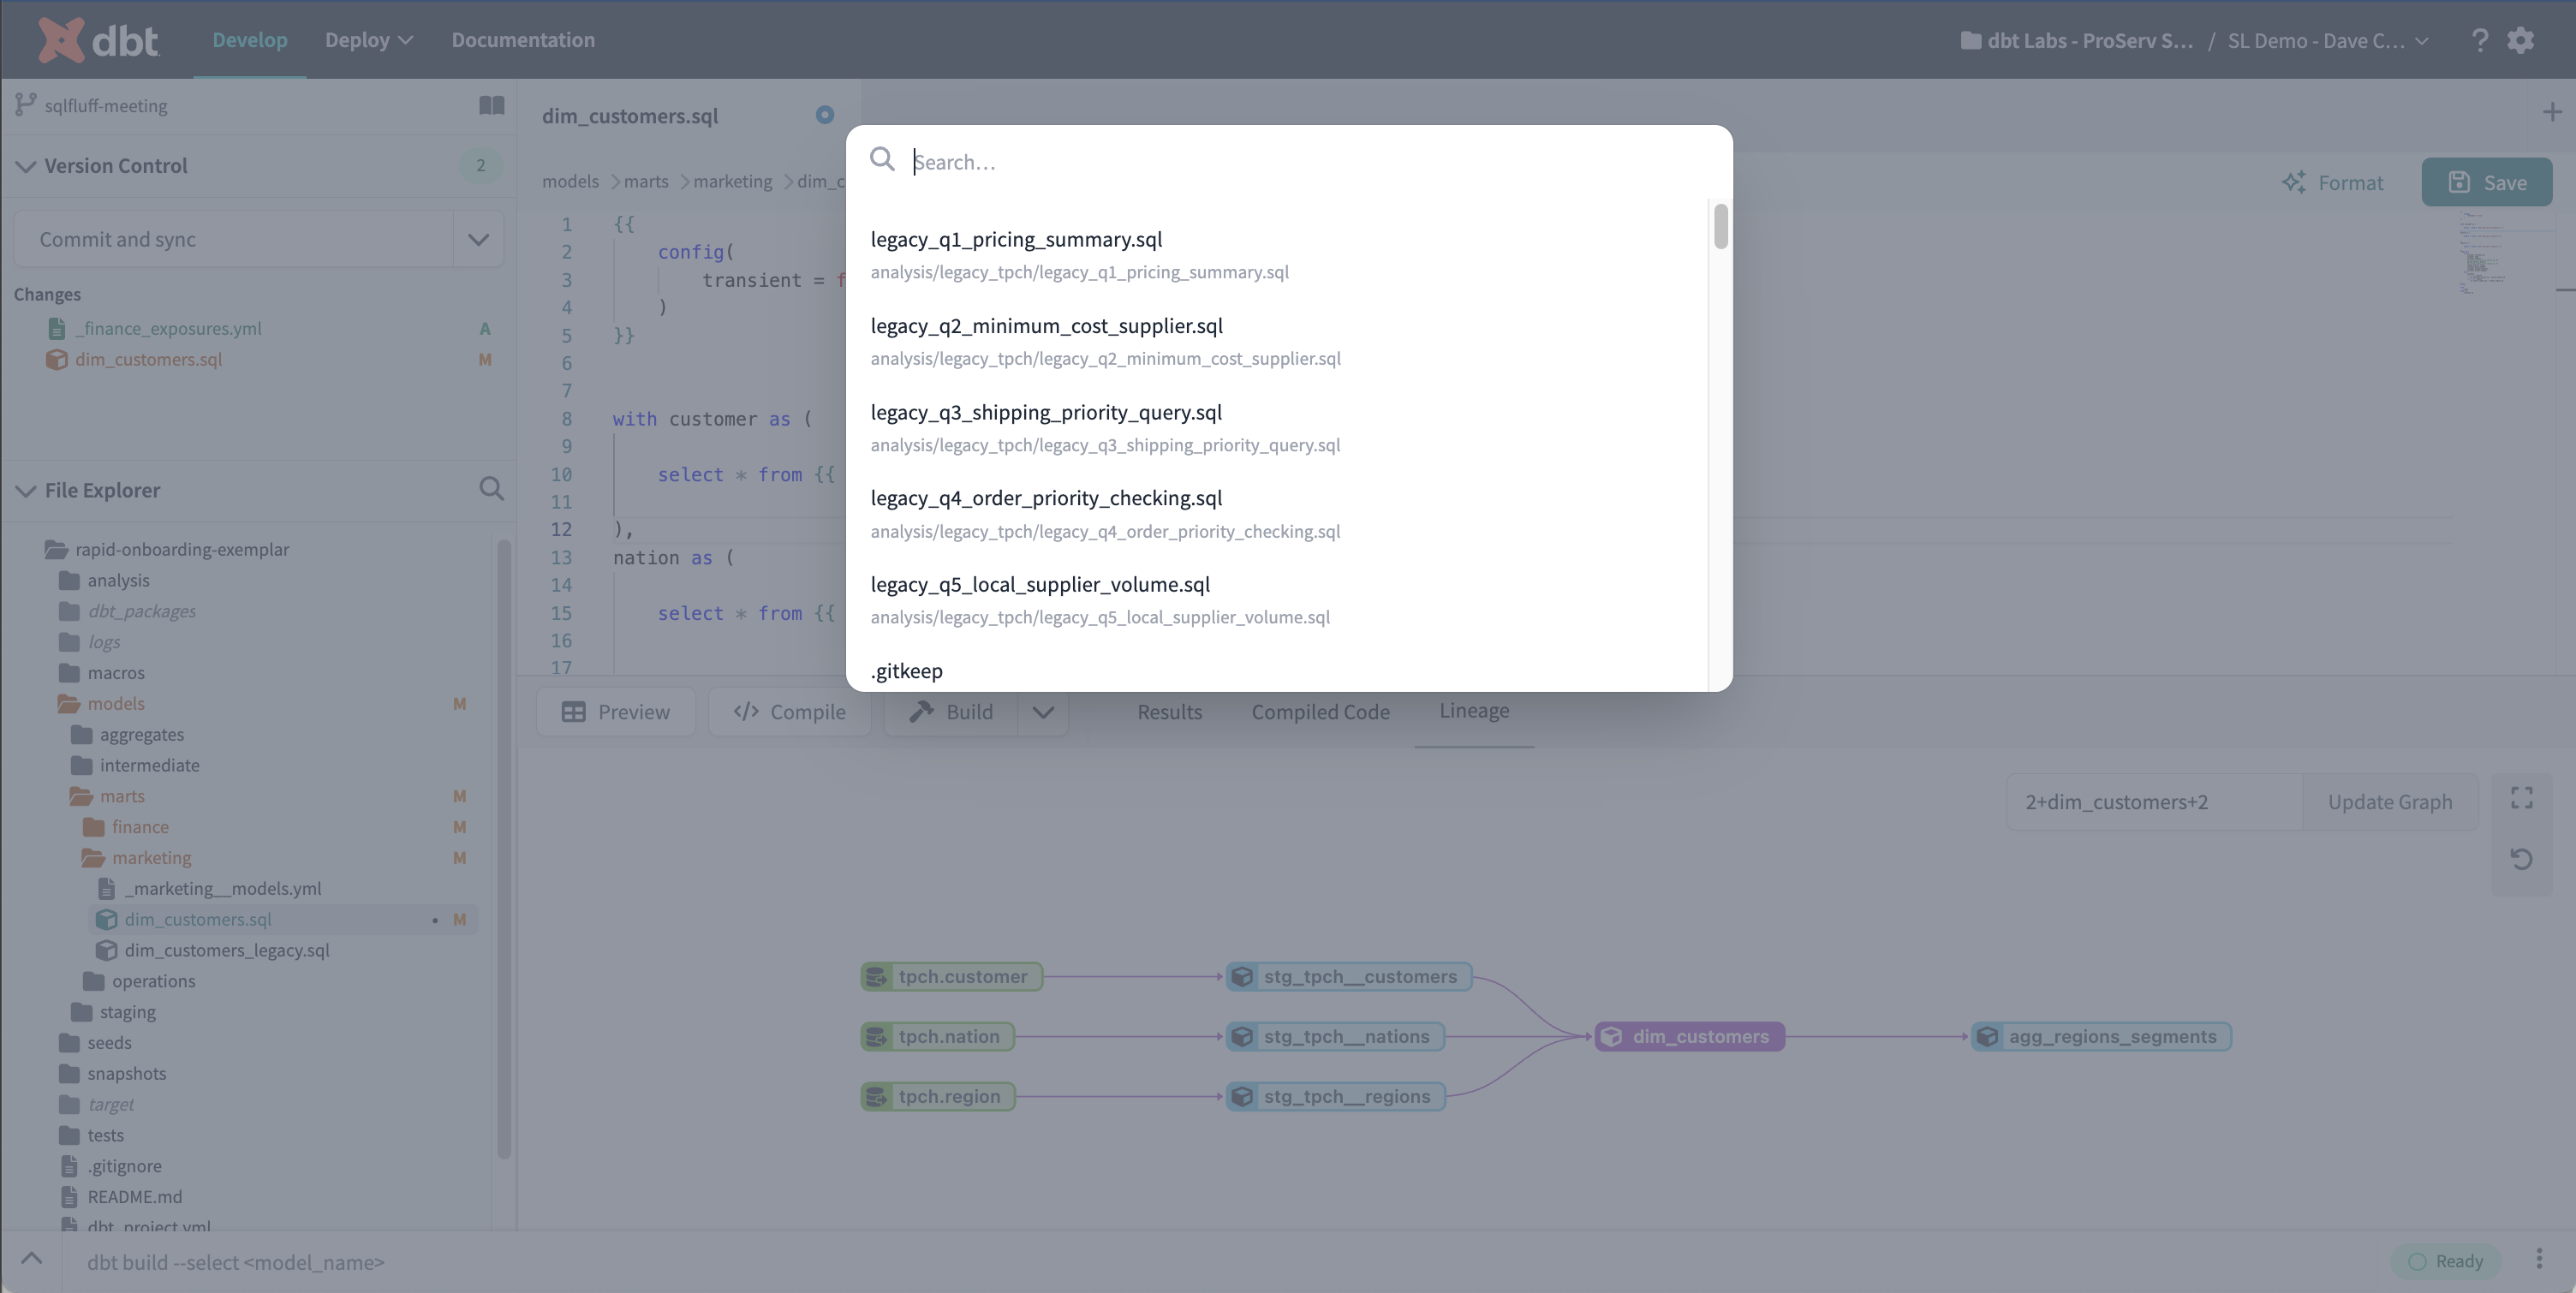
File Search
You can easily search for and navigate between files using the File Navigation menu, which can be accessed by pressing Command-O or Control-O or clicking on the 🔍 icon in the File Explorer.
-
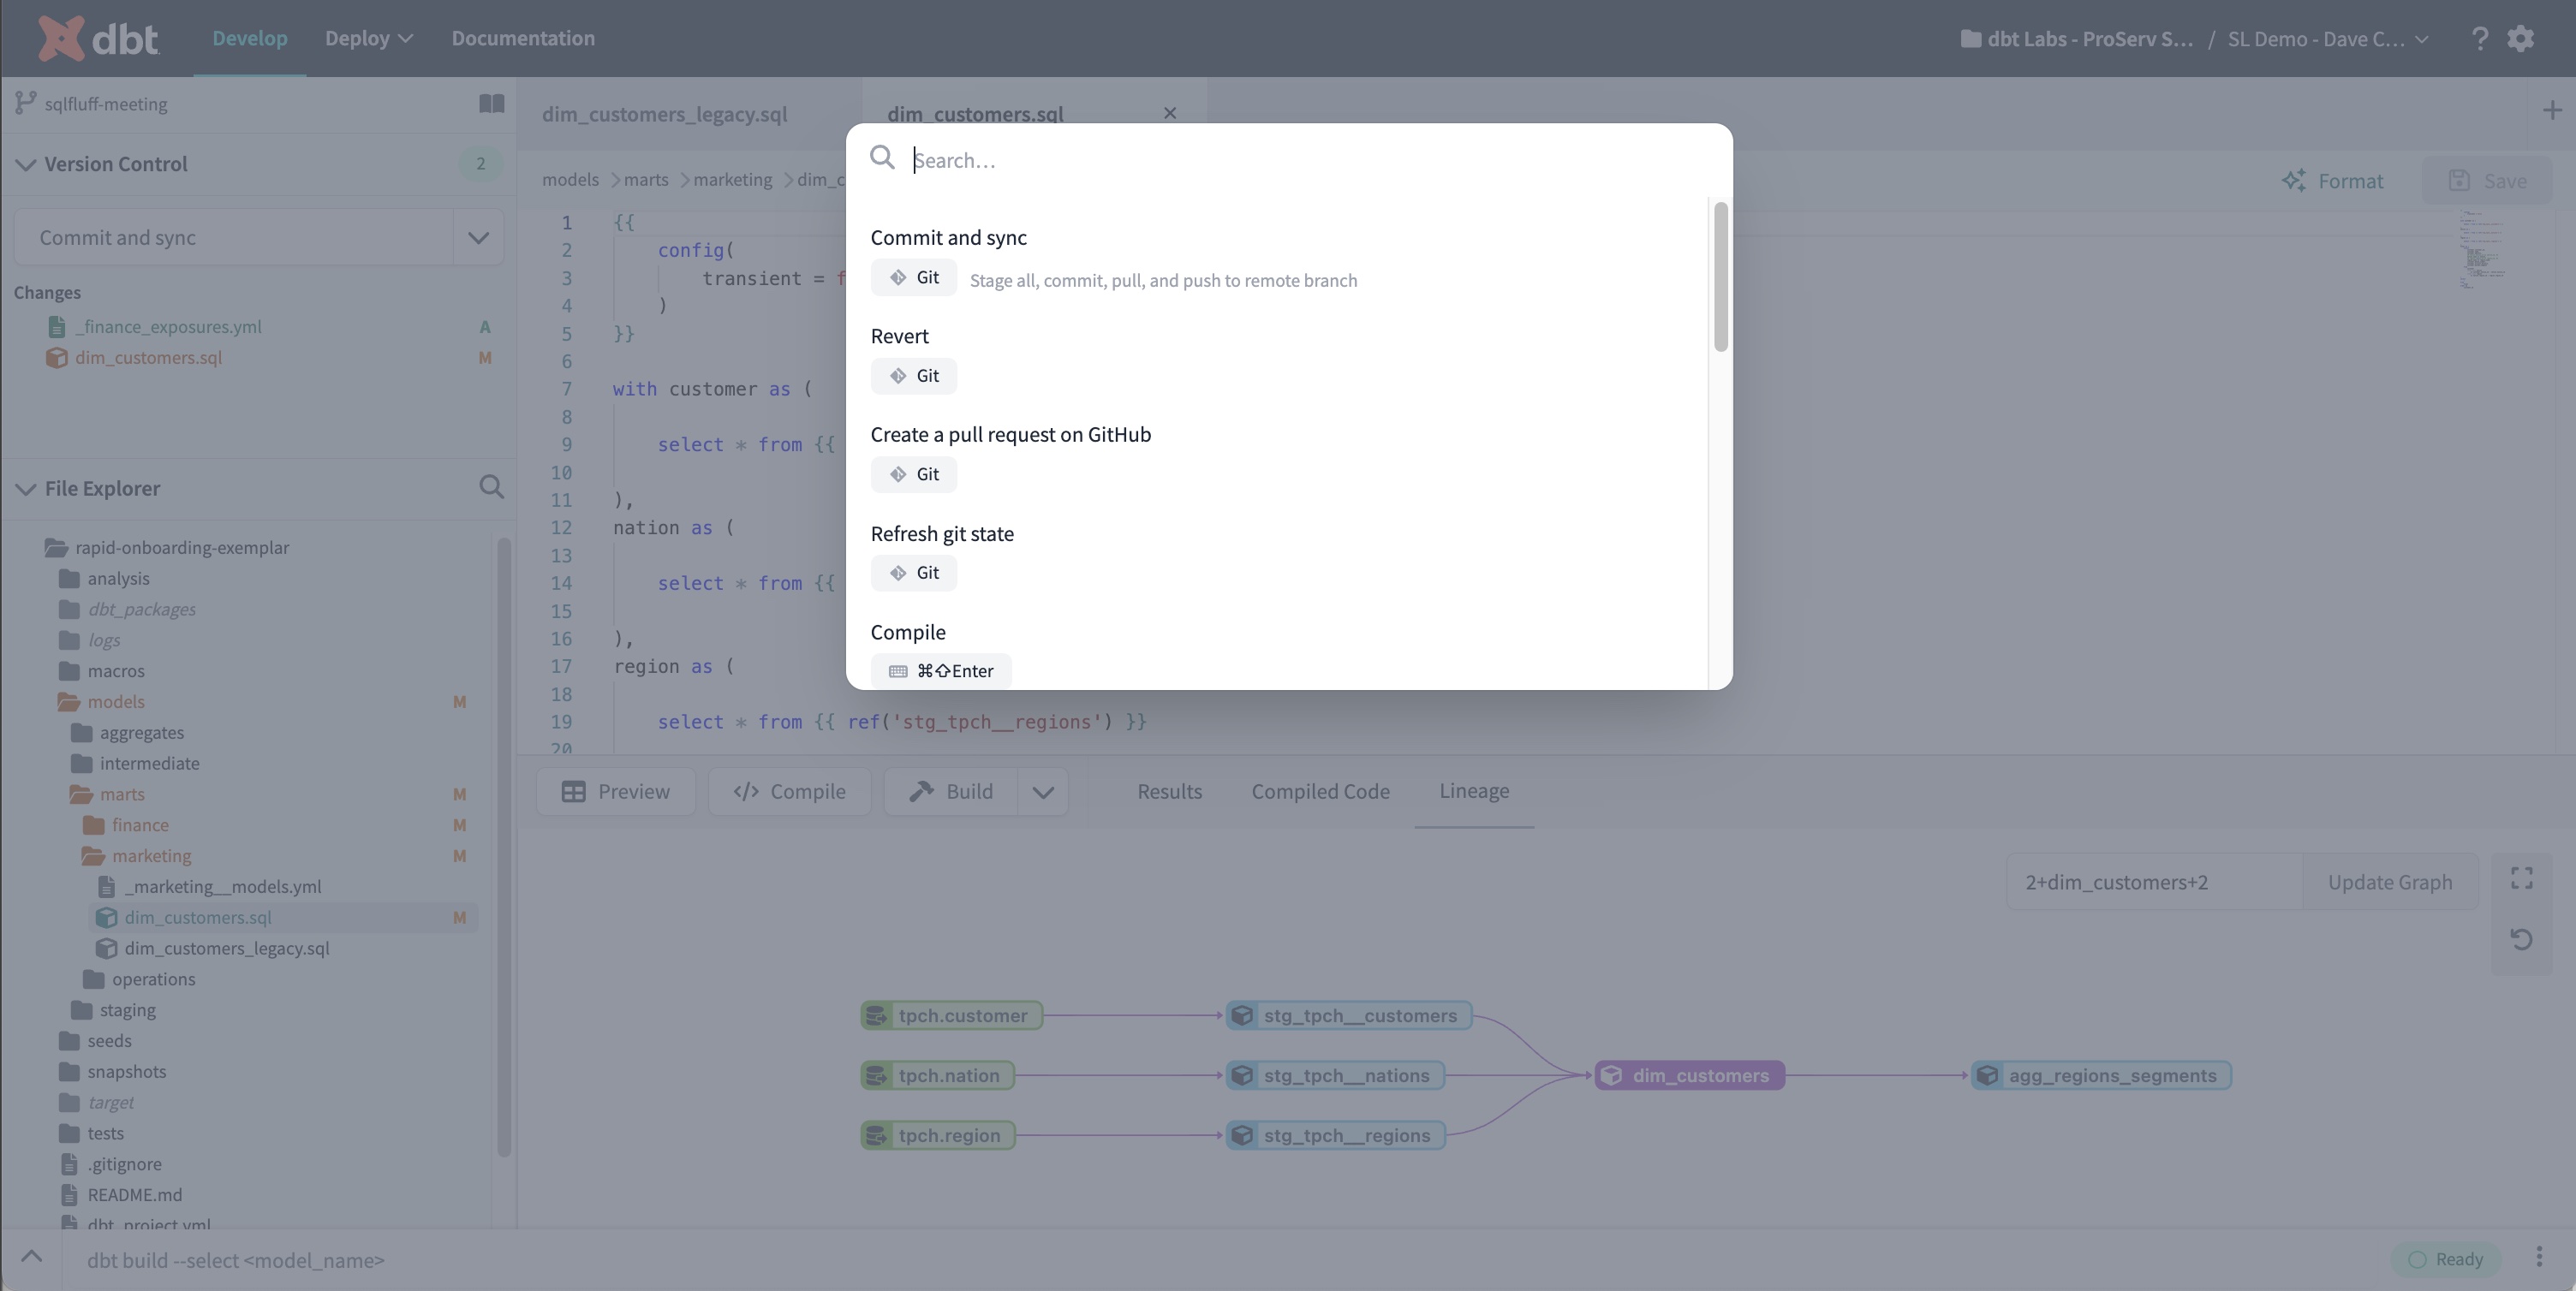
Global Command Palette
The Global Command Palette provides helpful shortcuts to interact with the IDE, such as git actions, specialized dbt commands, and compile, and preview actions, among others. To open the menu, use Command-P or Control-P.
-
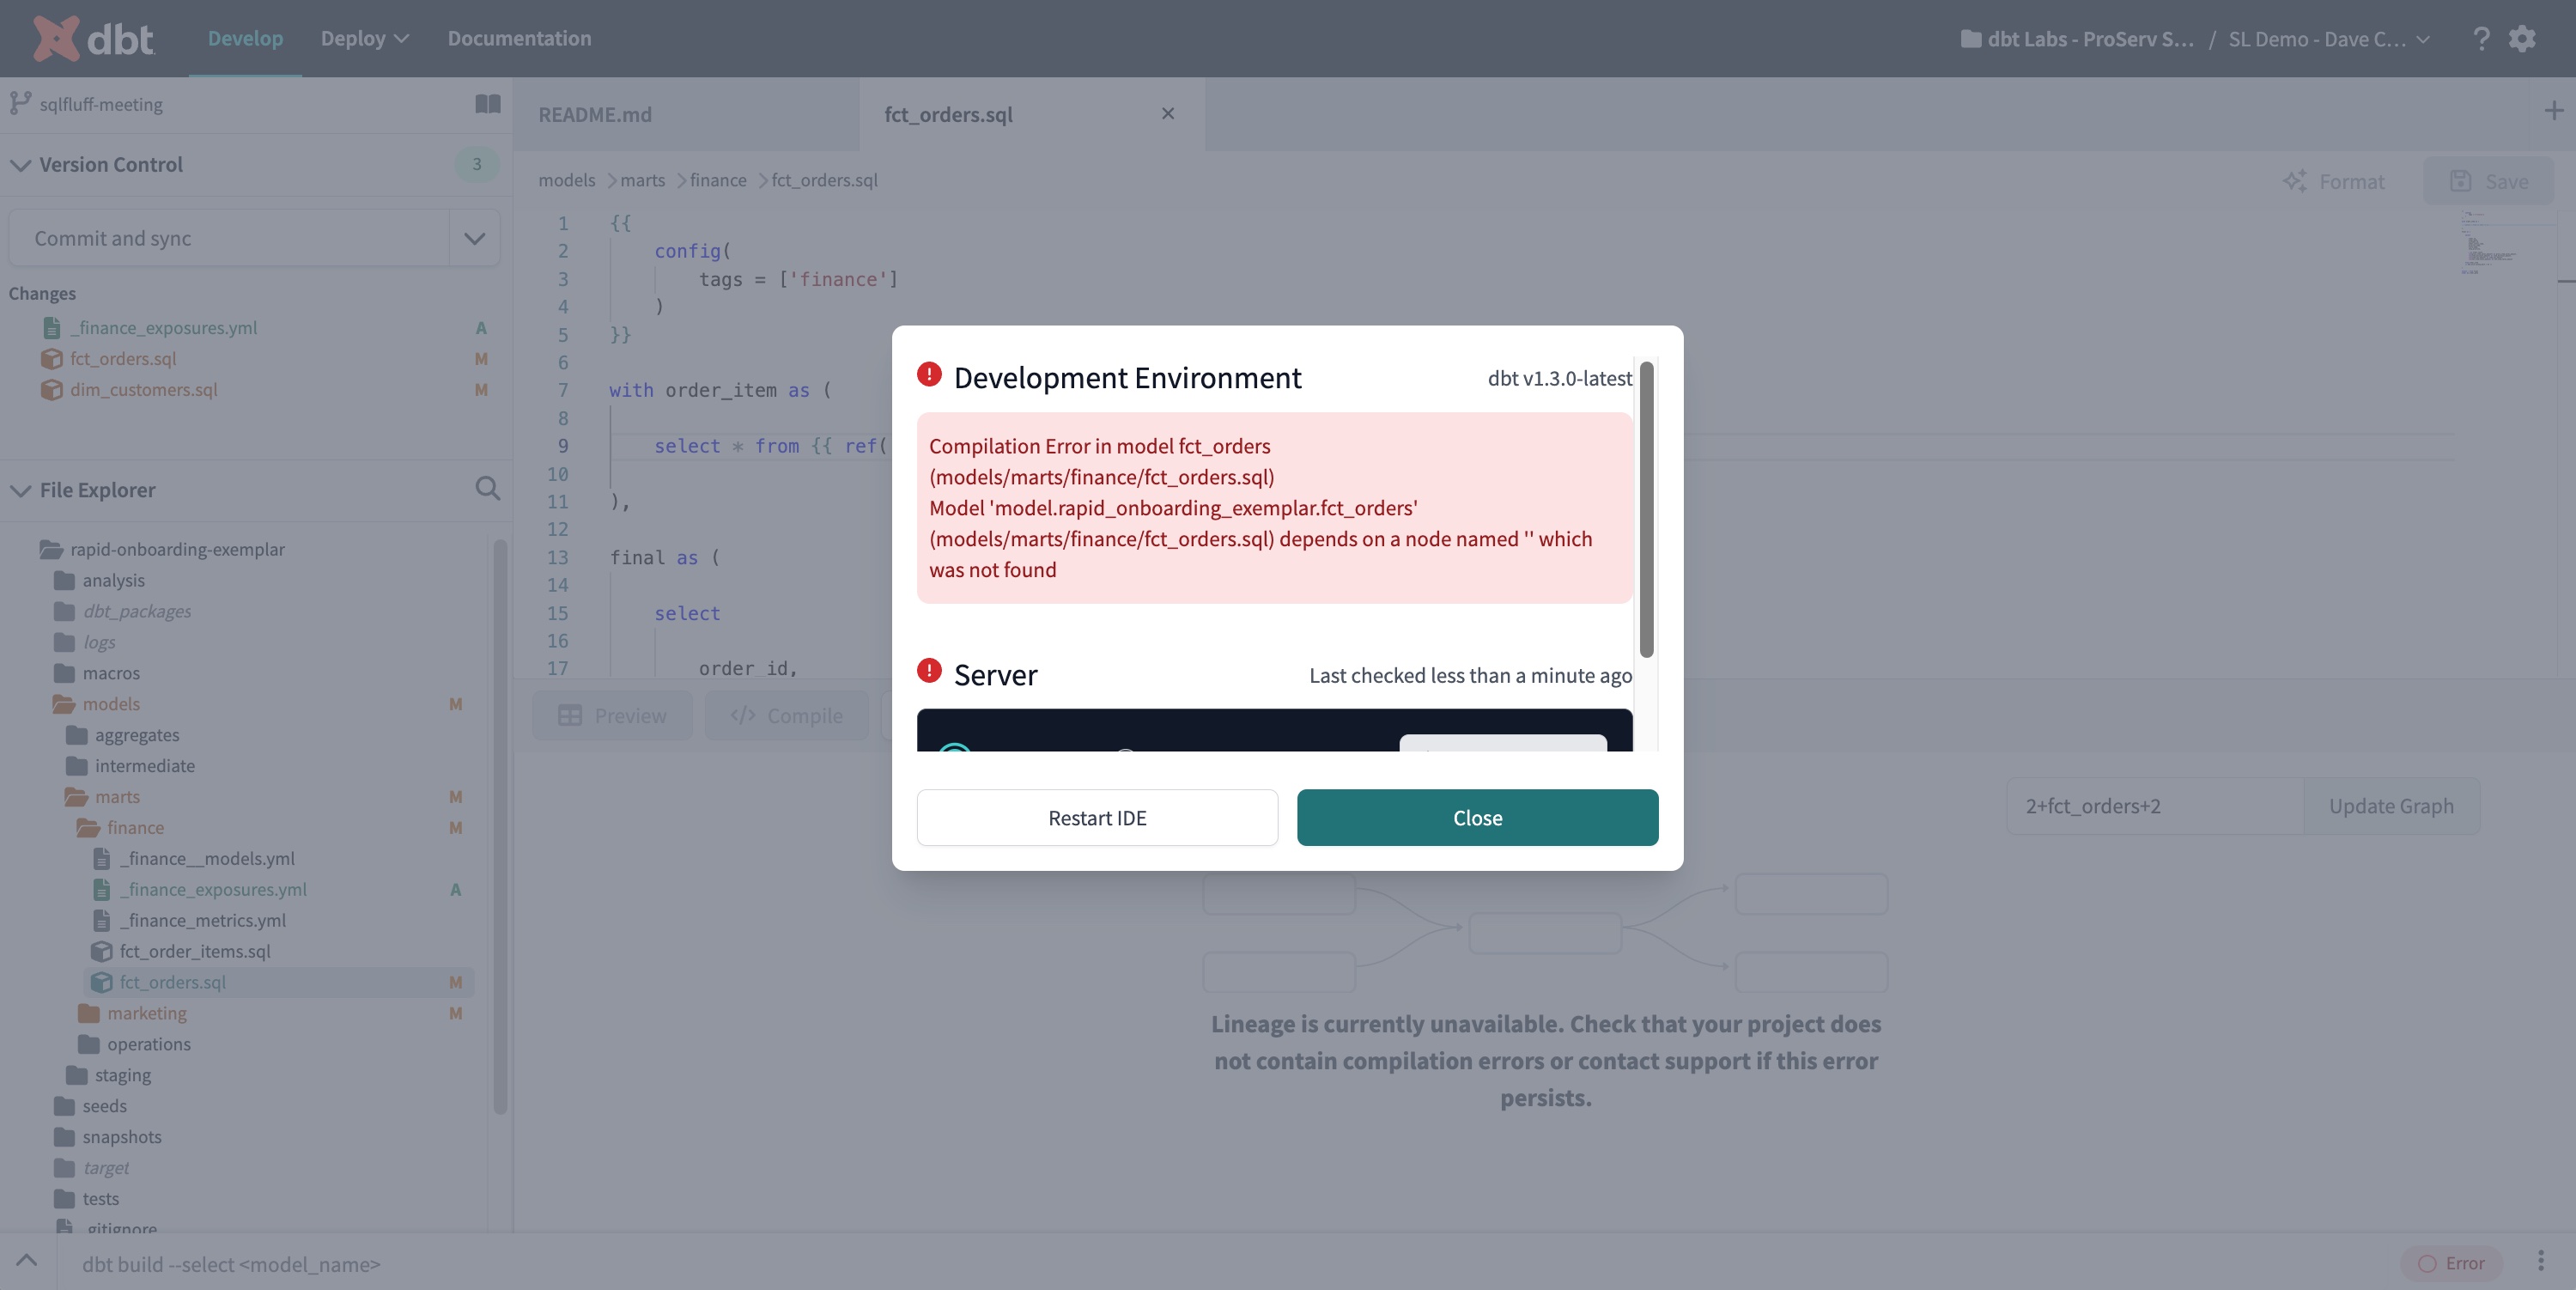
IDE Status modal
The IDE Status modal shows the current error message and debug logs for the server. This also contains an option to restart the IDE. Open this by clicking on the IDE Status button.
-
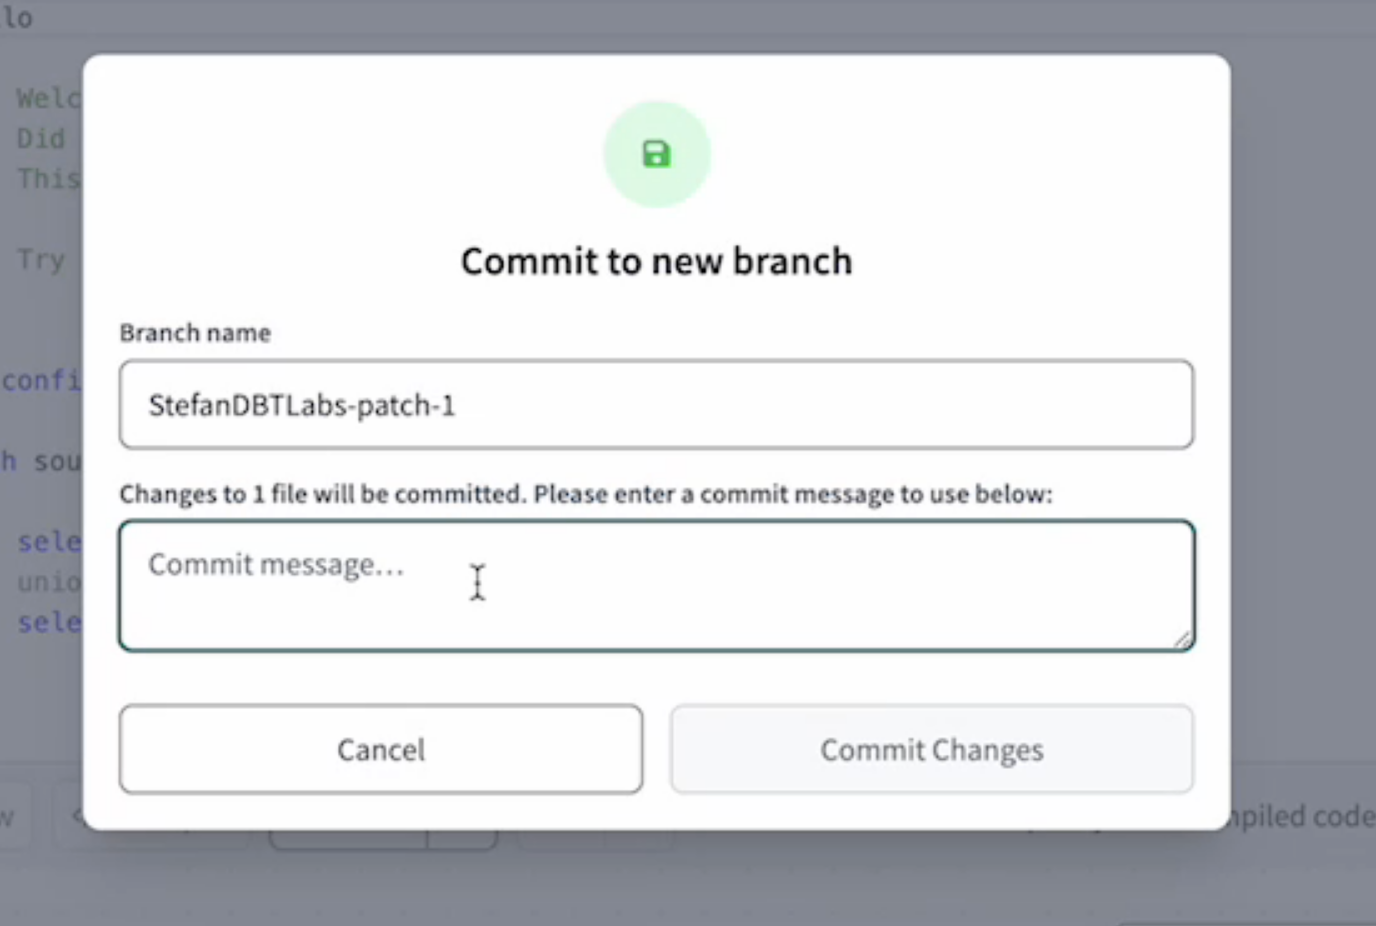
Commit to a new branch
Edit directly on your protected primary git branch and commit those changes to a new branch when ready.
-
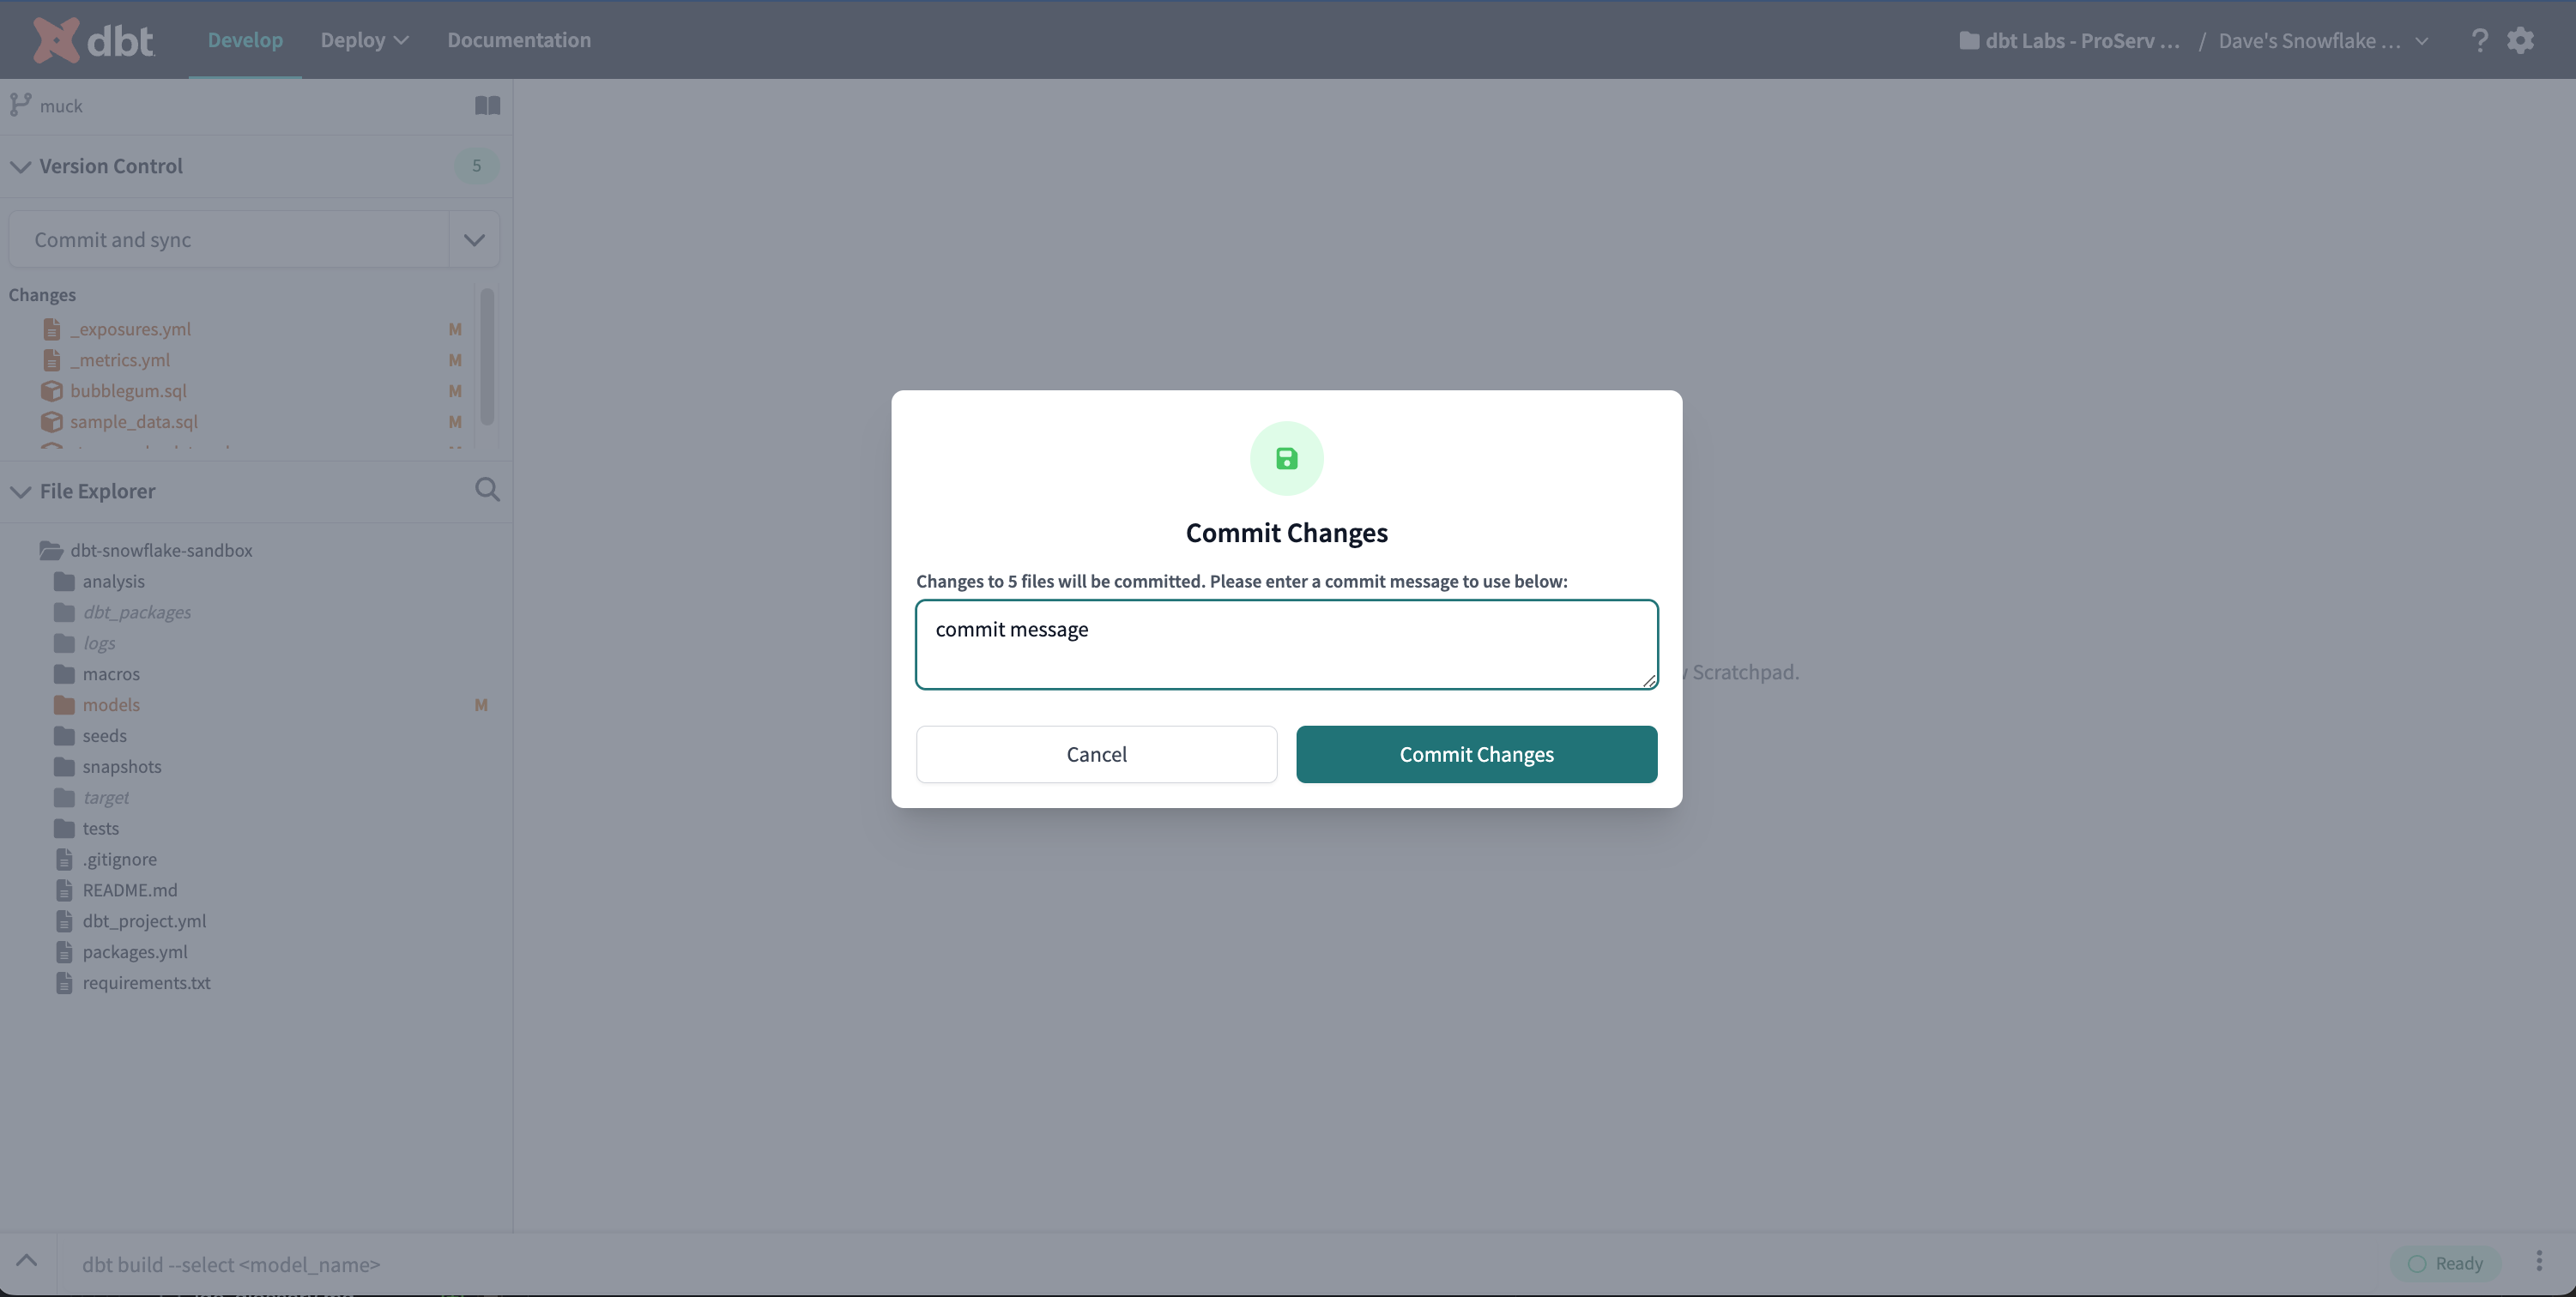
Commit Changes modal
The Commit Changes modal is accessible via the Git Actions button to commit all changes or via the Version Control Options menu to commit individual changes. Once you enter a commit message, you can use the modal to commit and sync the selected changes.
-
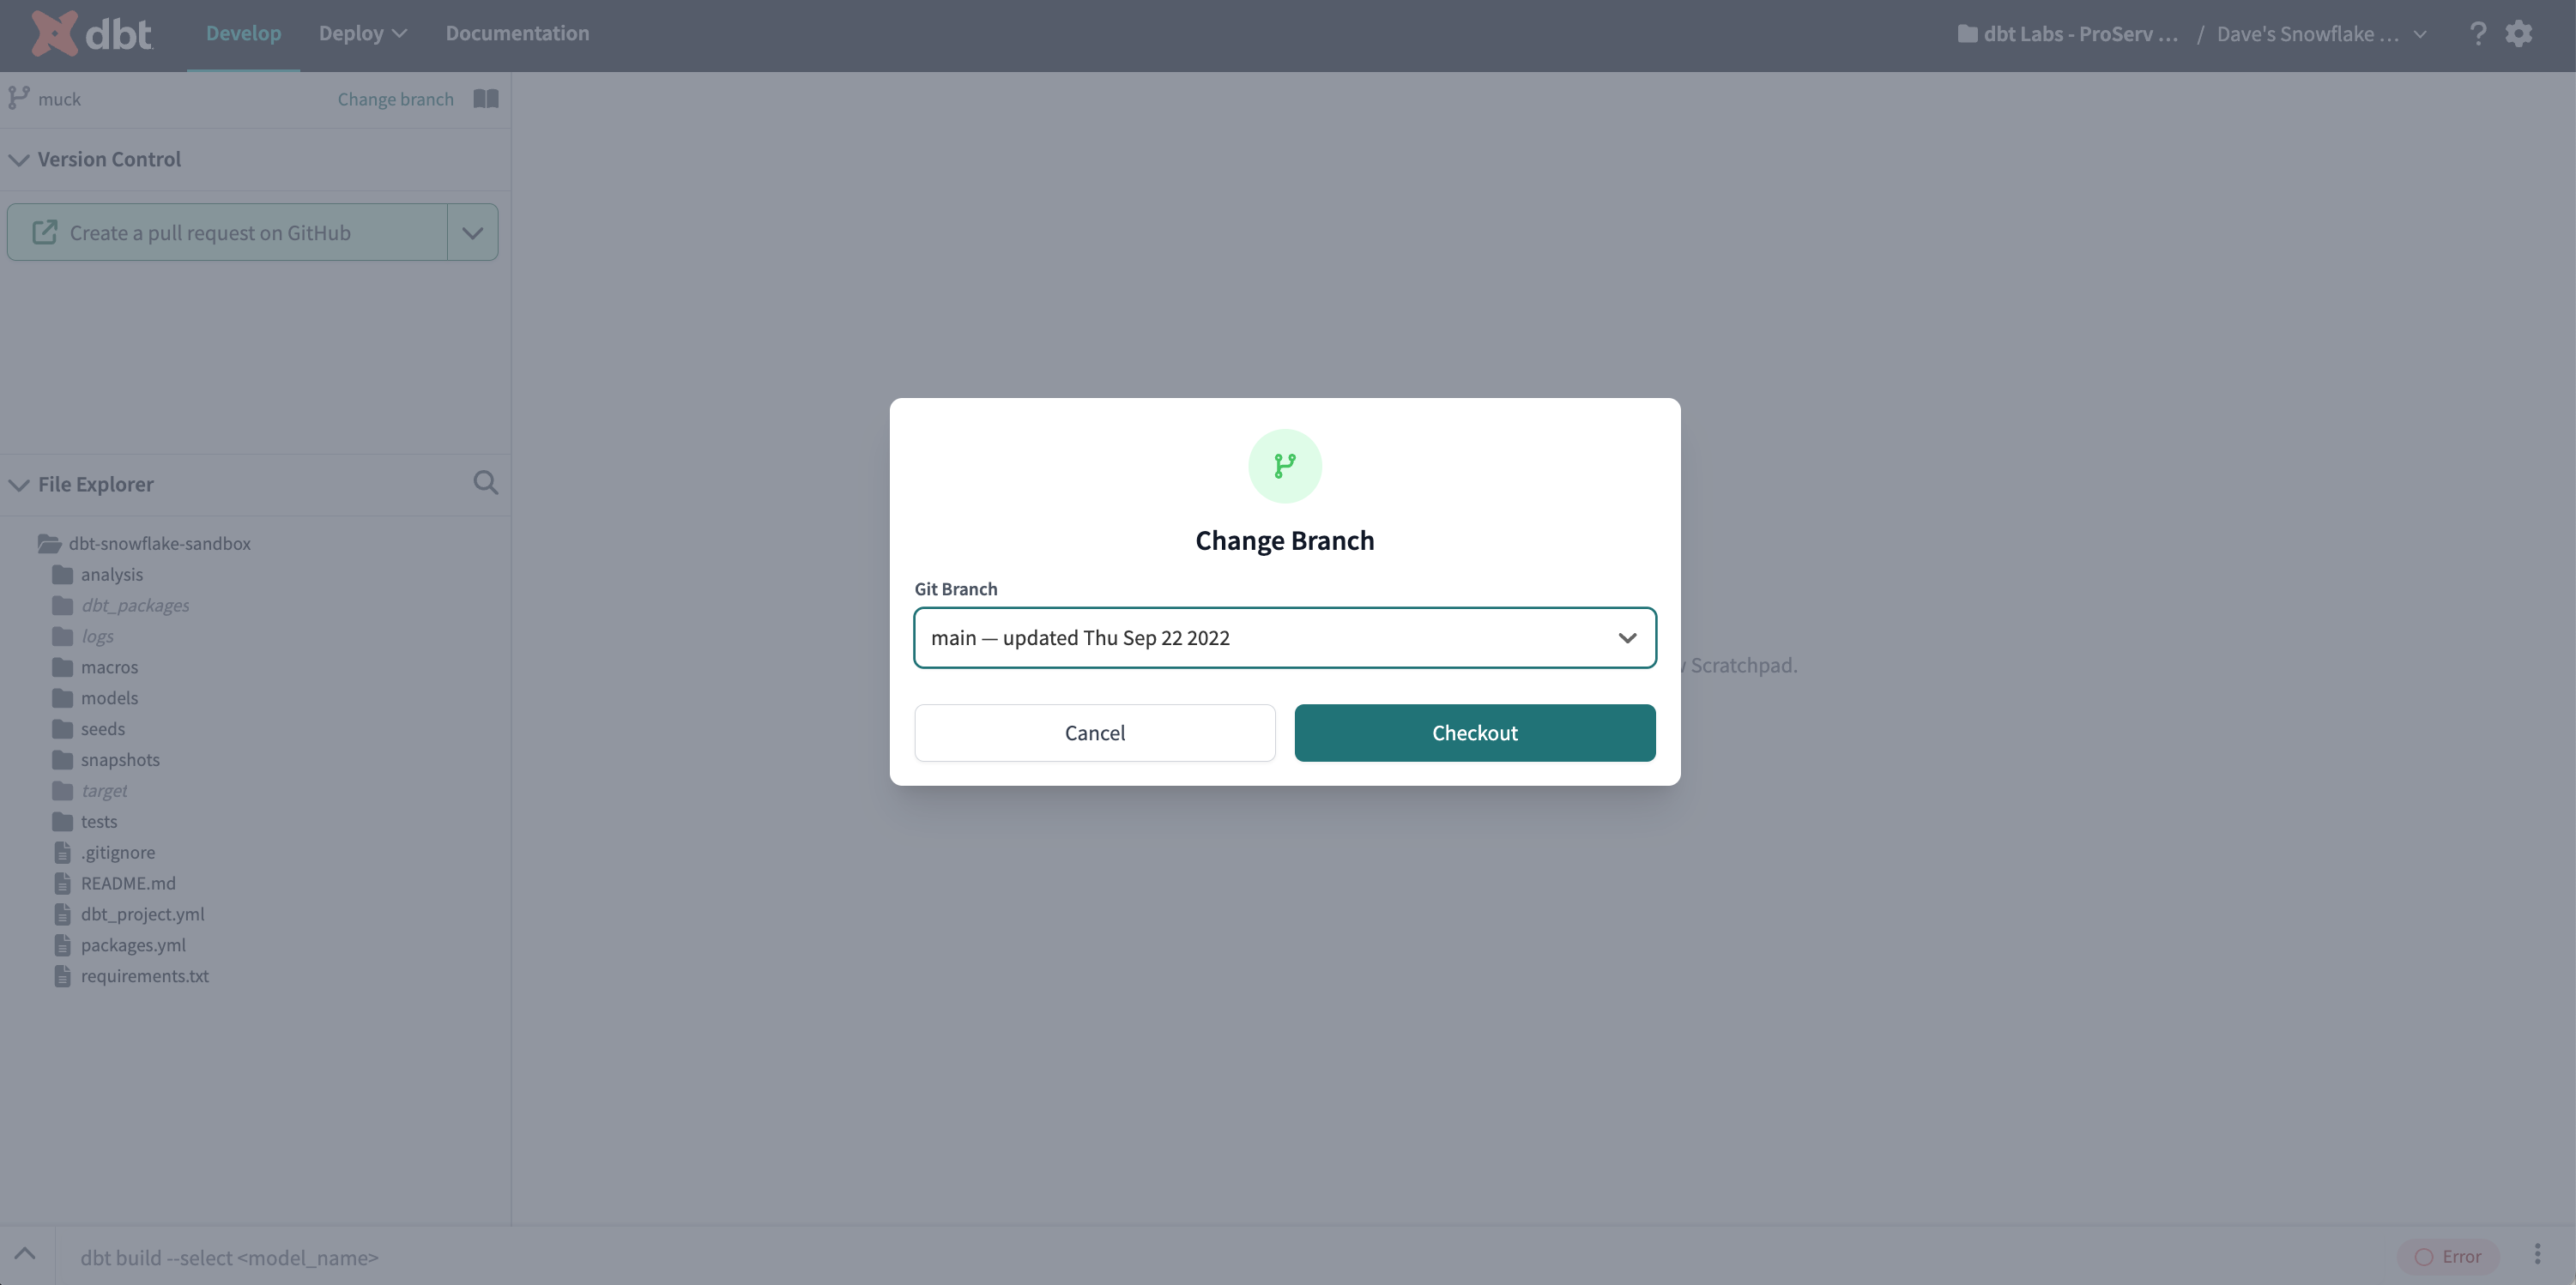
Change Branch modal
The Change Branch modal allows users to switch git branches in the IDE. It can be accessed through the Change Branch link or the Git actions button under the Version control menu.
-
Prune branches modal
The Prune branches modal allows users to delete local branches that have been deleted from the remote repository, keeping your branch management tidy. This is accessible through the Git actions button under the Version control menu. Note that this won't delete the branch you're currently on. Pruning branches isn't available for managed repositories because they don't have a typical remote setup, which prevents remote branch deletion.
-
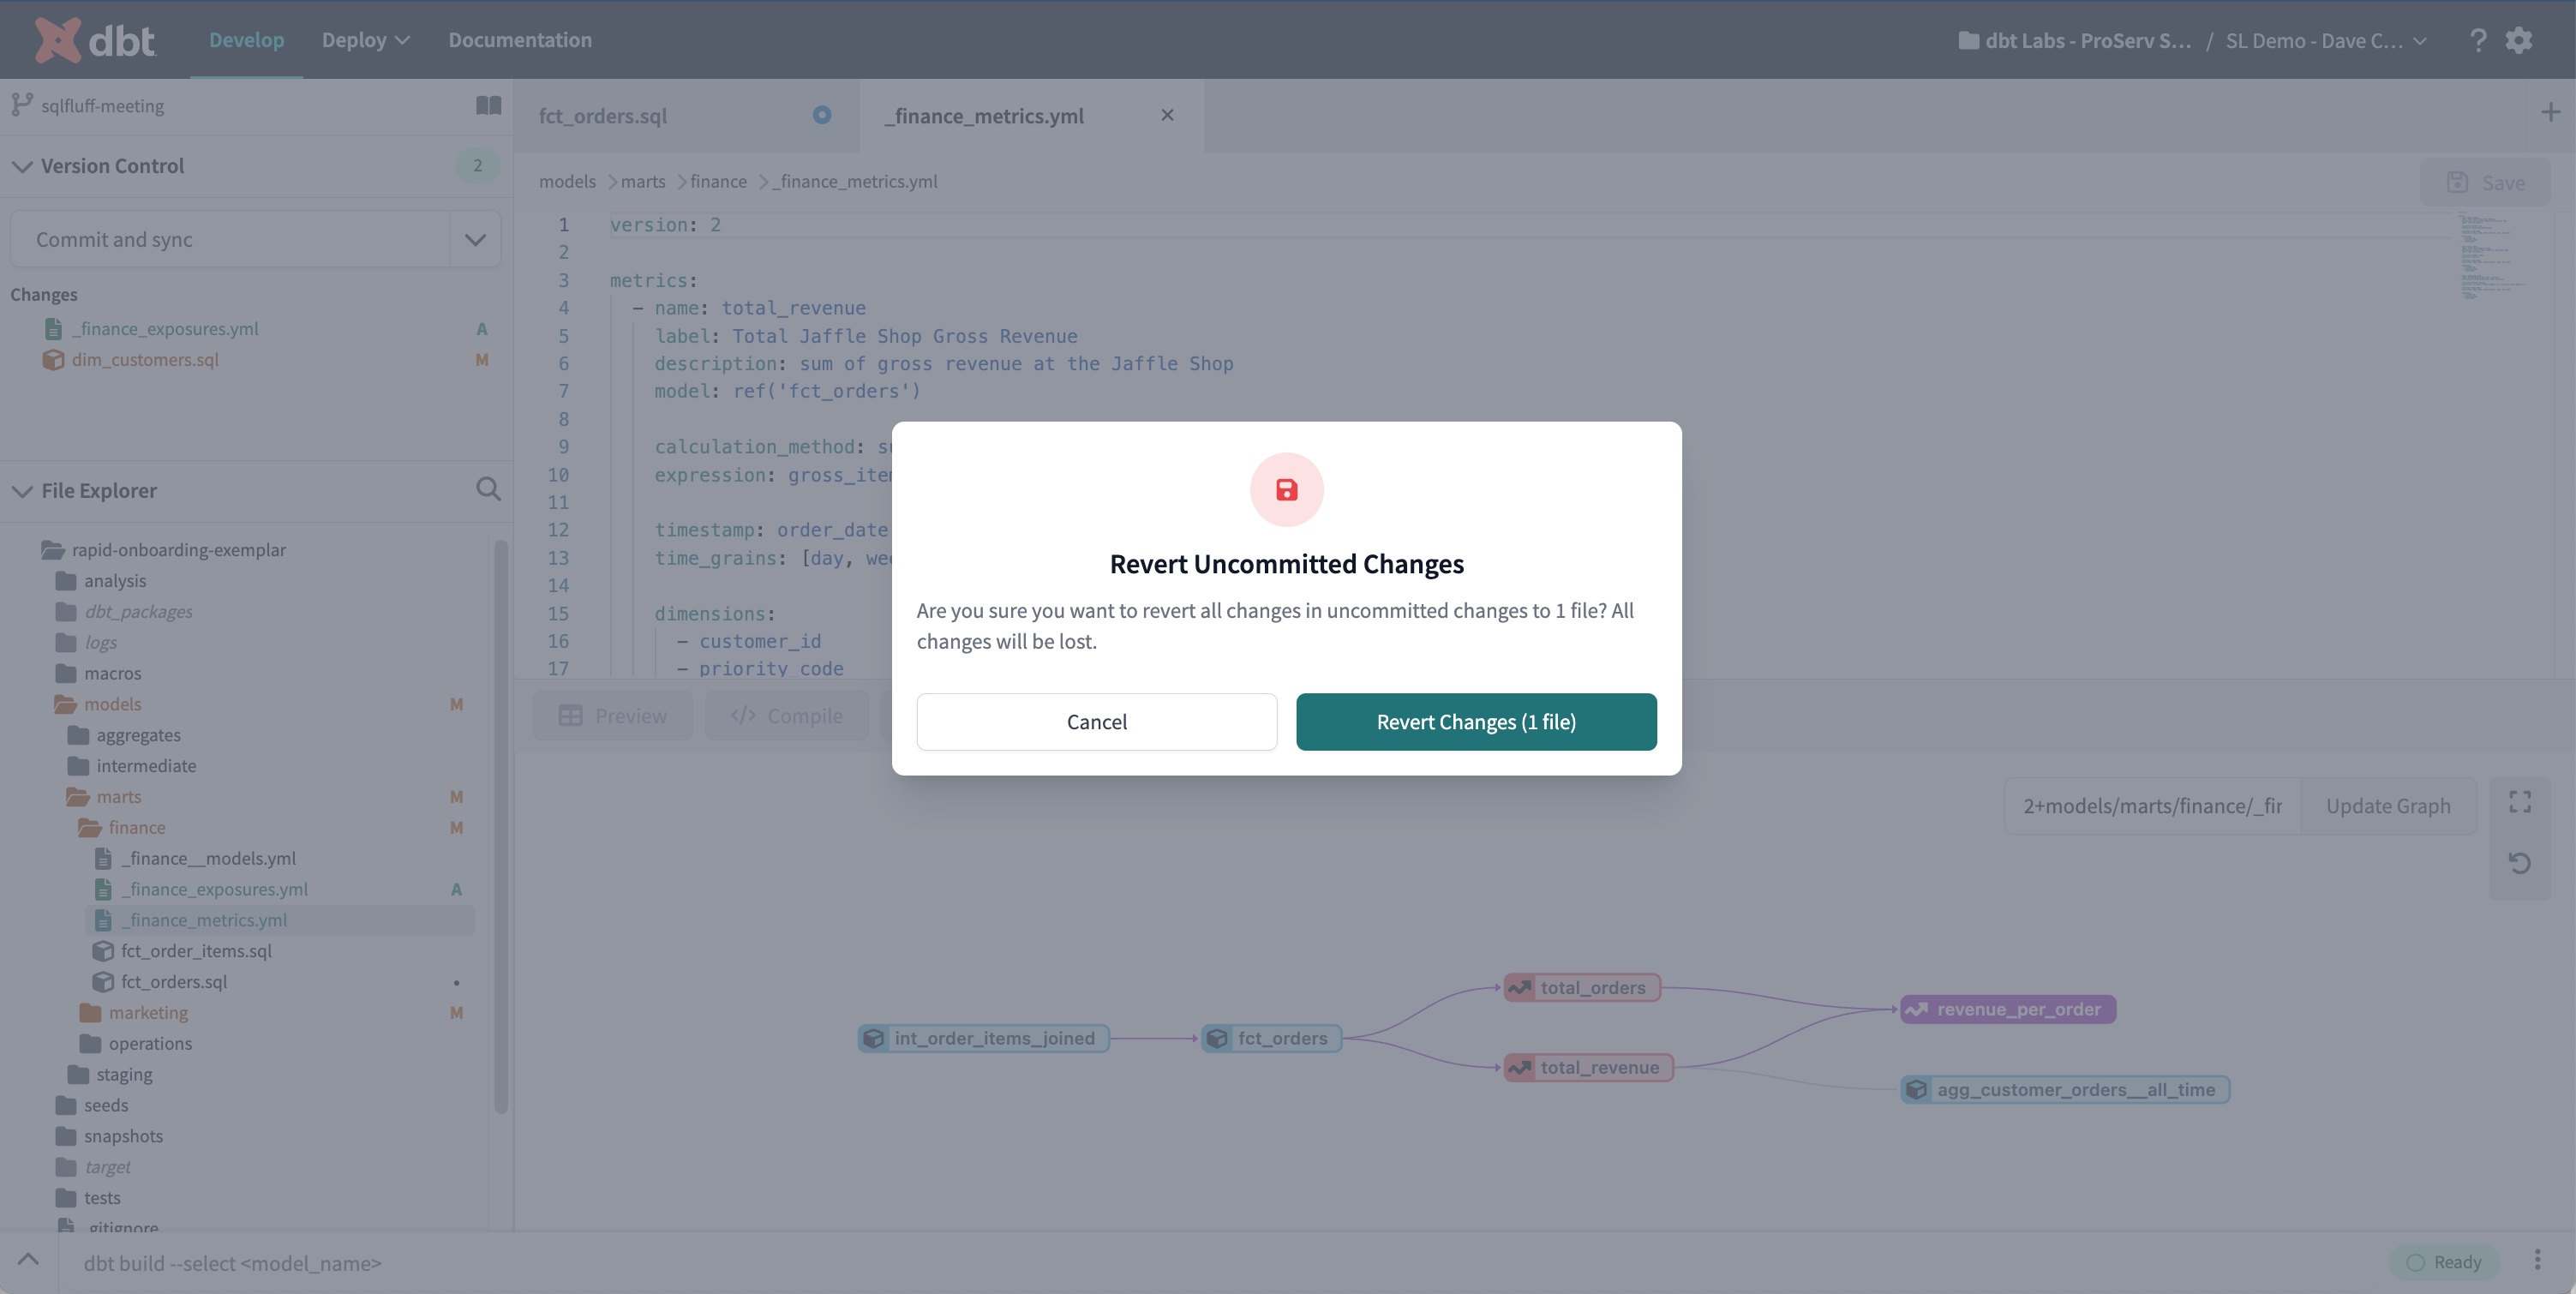
Revert Uncommitted Changes modal
The Revert Uncommitted Changes modal is how users revert changes in the IDE. This is accessible via the
Revert Fileoption above the Version Control Options menu, or via the Git Actions button when there are saved, uncommitted changes in the IDE. -
IDE Options menu
The IDE Options menu can be accessed by clicking on the three-dot menu located at the bottom right corner of the IDE. This menu contains global options such as:
- Toggling between dark or light mode for a better viewing experience
- Restarting the IDE
- Fully recloning your repository to refresh your git state and view status details
- Viewing status details, including the IDE Status modal.
