Narrative modeling: How structure can tell a story

The larger a data ecosystem gets, the more its users and stakeholders expect consistency. As the ratio of data models to team members (to say nothing of stakeholders to team members) skyrockets, an agreed-upon modeling pattern often acts as scaffolding around that growth.
The biggest tool in the toolbox today, dimensional modeling, offers enough consistency to make it the dominant approach in the space, but what might be possible if we shut that toolbox, took a break from our workbench, and instead strolled over to our bookshelf?
In other words, what if we told a story?
“When business questions come, they come not single spies, but in battalions.” - noted data professional William Shakespeare
This is, perhaps, a more collaborative way to describe the analytics engineer / stakeholder relationship than “if you give a mouse a cookie.”
After all, business questions should multiply, following the path from “What happened?” to “Why did that happen?” to “How can we predict what happens in the future?” and finally “How can we make something else happen instead?”
What does this look like in practice? Let’s take an example:
How many orders came in last week?
With a straightforward question, formal modeling principles may not be important. You have the source data you need and the information requested. Name it something that works and move on. It’s that simple.
It’s not that simple.
How many of the placed orders were fulfilled within three days?
How many items were in each order?
How many of the orders were returning customers?
Business curiosity is the quintessential hydra (just look at a dbt DAG), and the analytics engineer should know better than to think a single head is the end of it.
With an exponential growth in scope, however, comes a question of consistency. Modeling at scale is often easier with a structural framework. Specifically, principled naming conventions and database design help analytics engineers keep flow through stylistic decisions to focus on the request at hand, while providing other team members the ability to support follow-up questions on models they may not have built in the first place.
The leading solution
So what conventions should we use in our projects?
History and gravity have pulled many a team towards dimensional modeling, building business molecules out of atomic fcts and dims. This approach benefits from well-deserved “if it ain’t broke” adoption as well as a commanding market share of data team practices.
Within this framework, our business question would likely be answered from a table called fct_orders, because an order is, in a sense, an event. It might have a customer_id field that ties it to another model, dim_customers.
These are actually common examples of a fact/dim structure, and if we have this tried-and-true approach, it may not make sense to seek another one. Any alternative would have to have similarly reliable conventions while offering some additional benefit to be worth the departure from the norm.
But what if that additional benefit was clarity?
Introducing narrative modeling
In the past, I’ve used a framework I call narrative modeling, naming and structuring data models so that they tell the story of the business. Unlike dimensional modeling, which was born out of a need to solve a technical problem (expensive data storage), the principles of narrative modeling are people-oriented:
- Navigating an analytical database should be intuitive and educational
- Traversing the underlying code for an analytical database should be intuitive and stakeholder-friendly
- Adding to an analytical database should be intuitive and scaleable
Out of those principles came three primary conventions: event tables, details tables, and entity schemas.
Event tables
First, the backbone of a good narrative is the plot: what happened? In our example, How many orders came in last week?
To answer this question, we still need one row per order placed, with timestamps so that we can filter down to specific time periods (e.g. last week). But what should we name it?
Every principle of narrative modeling included the word “intuitive”. With that in mind, let’s call this table order_placed.
In narrative modeling, we’d call order_placed an event table. Event tables have the naming convention of subject_verb .
If this looks similar to fct_ tables, it is! However, the benefit of order_placedover fct_orders appears when you need an additional order-level event. For instance, How many orders were fulfilled last week?
- In dimensional modeling, you already used
fct_orders, so you likely would need to rename that model. This can result in naming conventions likefct_order_placementandfct_order_fulfillmentwhich can feel like reporting on two separate entities rather than two things that can happen to orders. - In narrative modeling, the sky’s the limit as we stand up
order_fulfilledalongsideorder_placedwith room fororder_cancelledand all matter of other steps along an order’s flow.
Now we can model out the narrative thrust of an order, but events can be a little dry without a fleshed-out protagonist. How would we describe our hero, a single order?
Details tables
In narrative modeling, details tables are where a user can expect to find more descriptive information about a particular business entity.
In the example of orders, an order_details table might contain fields like:
customer_iditems_orderedpayment_method
Initially, it might seem as though these should just be fields on order_placed and, for those examples, it’s a reasonable point1. Consider instead the following:
items_fulfilleddays_to_fulfillment
One can imagine a stakeholder wanting to know all five of these data points, but the context for them comes from multiple events in the order’s flow. A _details table allows us to assemble a broad bank of knowledge about a given entity (in this case, an order) in one place. If data refresh is performant enough, this could even be the place to surface true snapshot fields like status orcurrent_location.
So we have everything that happened to our order and everything we’d want to know about it. Now let’s put it all together…literally.
Entity schemas
I mentioned above that navigating an analytical database should be intuitive and educational. Given the building blocks of event and details tables described above, the intuitive part could be considered complete just by naming convention. If all of our data models were in a single schema, then the following tables would likely sort together:
order_cancelledorder_detailsorder_fulfilledorder_placed
Keeping related information grouped seems sufficient for usability. Then again, I’ve seen enough analytical databases where the database and schema have the same name (e.g. DATA_MARTS.DATA_MARTS.*) to see an opportunity for building a database that describes the business as soon as you open it.
Throughout our example, order has been an entity we want to know a lot about. Any undertaking that creates business questions will have dozens if not hundreds of entities that people care about. Even in our example, we’ve glanced off other entities, such as item and customer.
Grouping the models for each entity under a schema named for that entity builds out a database that describes the scope of the business in simple terms, while also allowing stakeholders using the database to navigate more purposefully, expanding schemas rather than scrolling tables in a single mega-schema.
analyticsdatabasecustomerschemacustomer_detailscustomer_created
itemschemaitem_detailsitem_fulfilled
orderschemaorder_cancelledorder_detailsorder_fulfilledorder_placed
This structuring principle can also help address the boogeyman of business entity resolution, overlapping names. If you’re a business that orders parts regularly and then fulfills customer orders, the question How many orders came in last week? can get a lot more confusing. At a fast-moving company, a new hire could be asked the question and answer in the wrong context completely2, because the tenured stakeholder can no longer imagine mixing them up.
If instead, the database had schemas forparts_order andcustomer_order, that same new hire hits the database, sees those schemas, and thinks “Oh, there are two types…I should probably ask which.” That distinction can be a lot harder to spot in a single analytics schema.
Intuitive and educational.
Let’s get visual
One of the most powerful ways for stakeholders to conceptualize the flow of data through a dbt project is through the DAG visualization in dbt docs. If we consider it a goal of ours to capture business knowledge and have conversations about how we ascertain that knowledge, let’s consider how the two options manifest in their DAGS:
Dimensional modeling
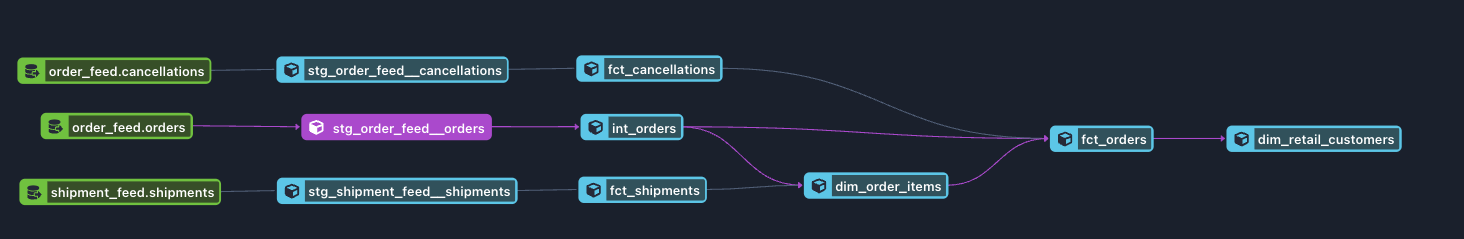
In this approach, we have the standard fct and dim tables and a clean DAG flow. Let’s consider some possible shortcomings:
- Because I made this flow, I know that the
fct_shipmentstodim_order_itemstofct_ordersrepresents a knowledge flow. A package got shipped with items in it, meaning those items themselves are now shipped and if all of the items in a given order are shipped, then the entire order is fulfilled. However, for a new person to learn that in this approach, they would need to enter the models themselves and look at the SQL for why they are dependencies. - We called the table
fct_ordersbecause orders are events. Because we can conceive of a stakeholder wanting to identify cancelled orders, we take anint/fctapproach, but now the intent offctfeels a little murky. It captures an event, order placement, at which time we don’t know it will be cancelled. We could potentially createdim_ordersandfct_order_placementsif we want to capture both, but that suggests thefct/dimdesign is much more of a choice, one different developers in your codebase might approach differently.
In general, the dimensional DAG can begin to feel like it’s not for a user who only has a business context, which can keep the structural decision-making purely on the analytics engineer or at best only the most technically-adept stakeholders.
Narrative modeling
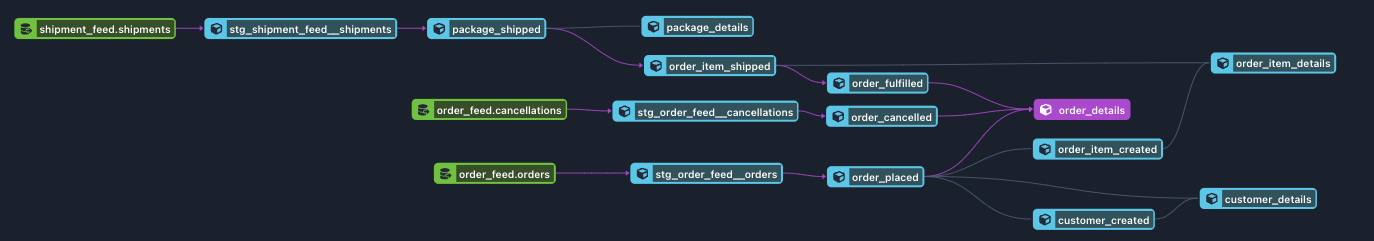
How does this compare to the above?
- Now we’re being explicit about our dependencies. We’re telling the viewer we infer items were shipped from packages being shipped, then use those items to identify when an order was entirely fulfilled.
- The order placement and fulfillment steps are both explicit, flowing into an
order_detailstable where we can also calculatedays_to_fulfillment - The DAG does look a little more complex, with additional nodes and a broader base of final models on the right compared to the slimming effect of the dimensional modeling. This potential drawback could use some contextualization:
- First, we are being more explicit about the business questions we are answering, so each of the milestones of an
orderthat might have previously been tucked into the CTEs offct_ordersis now a node unto itself - Second, remember the hydra? Ideally, business questions beget business answers beget new business questions. If the knowledge base needs to expand, it’s reasonable that the DAG might as well. The key, however, is validating that each model is answering a question someone is asking
- First, we are being more explicit about the business questions we are answering, so each of the milestones of an
To that final point, if presented with the DAG from the narrative modeling approach, stakeholders can participate in the conversation. One can imagine a stakeholder looking at the flow and saying “Interesting that we say an order is fulfilled when each item ships. Perhaps we should get shipper data and declare an order fulfilled when all items are received.” Because we took the modeling structure as far as possible into business concepts, we can have a conversation on methodology without shouting over a great contextual distance.
Benefits in practice
Stakeholders find it easier to participate in data modeling
- They don’t need to learn the idiosyncrasies of fct/dim structuring (e.g. idea that only some business datapoints are called facts).
- The discrete models are framed as events or entities in the business, which means the stakeholder can compare the model’s logic to their subject matter expertise.
Intangible business steps are easier to model
- Knowledge gaps are captured accurately. For instance, if the best way you know that a shipment was received by a customer is that a truck driver scanned it out of the system, you can model
shipment_scanned_outas an explicit model, followed by an implicitshipment_receivedmodel referencing it. This stores in code the company’s current point-of-view that the scanning action is the best information available - Certain business decisions directly drive data transformations. If an entire package costs $50.00 to ship and it has multiple items inside, shipping cost could be attributed to each item via weight or product value. In either case, teams can capture this attribution as
item_apportioned_shipping_cost.
Users can tie business concepts to source data
- While the schema structure above is focused on business entities, there are still ample use cases for staging and intermediate tables.
- After cleaning up source data with staging tables, use the same “what happened” approach to more technical events, creating a three-node dependency from
stg_snowplow_eventstoint_page_click_capturedtouser_refreshed_cartand thus answering the question “where do we get online user behavior information?” in a quick visit to the DAG in dbt docs.
Should your team use it?
Narrative modeling primarily values comprehension as an outcome of data modeling, which can be a high priority for…
- …companies with a high stakeholder-to-data-team-member ratio.
- …companies with SQL-savvy stakeholders
- …companies looking to on-board new team members at a high rate (as the project in this case is a sketch of the business itself)
- …companies who can dedicate staffing and time to writing strong documentation so that the doors to the models can be thrown open.
Narrative modeling might not be the right fit for…
- …companies where storage spend, even in cloud warehouses, needs to be closely tracked. After all, fct/dim models emerged from a need to optimize data storage.
- …companies with BI tools that rely heavily on multi-entity tables. This can generally still work with narrative modeling, however, if there is an additional layer of standard datasets being modeled out of the shared components of your narrative models (to insure data stays in step across contexts).
A neverending story
There’s a classic movie called Desk Set in which Katharine Hepburn runs the reference desk of a major TV network and Spencer Tracy comes in to install a research computer in her department. In gladiatorial bouts of banter, the movie investigates the concept of knowledge and, in particular, how human it should be. At one point, Tracy’s Richard Sumner runs Hepburn’s Bunny Watson through a chunky “train left the station” word problem and I think about her response (abbreviated below) all the time.
Richard Sumner: Now, a train started out at Grand Central, with seventeen passengers aboard and a crew of nine. At 125th Street, four got off and nine got on. At White Plains, three got off and one got on. At Chappaqua, nine got off and four got on. And at each successive stop thereafter, nobody got off, nobody got on till the train reached its next-to-the-last stop, where five people got off and one got on. Then it reached the terminal.
Richard Sumner: How many people got off at Chappaqua?
Bunny Watson: Nine.
Richard Sumner: Uh, would you mind telling me how you arrived at that conclusion?
Bunny Watson: Spooky, isn't it? Did you notice that there are also nine letters in Chappaqua?
Richard Sumner: Are you in the habit of associating words with the number of letters in them?
Bunny Watson: I associate many things with many things.
Richard Sumner: I see. Hmm.
Bunny Watson: Aren't you going to ask me how many people got off at White Plains? Three.
Richard Sumner: But there are ten letters in White Plains.
Bunny Watson: No. Eleven.
Richard Sumner: [beat] But only three got off there.
Bunny Watson: You see, I've only ever been to White Plains three times in my whole life.
Much like Mr. Sumner, we would be hard-pressed to teach a computer to answer questions the way Bunny does. Her accumulated knowledge and how she accesses it is deeply human. Why, then, do we so often take the accumulated knowledge of subject matter experts across our business and abstract it AWAY from its context to capture it in a data model? Put another way, why do we store business answers in a way that, over time, forgets the questions?
Narrative modeling can help structure the data with questions and answers stored side-by-side, allowing us to be reference librarians with a killer card catalog. We can model out the expertise of the finance team or the marketing team or the product team in their own words, which keeps the context for not only the next person to join those teams, but also the next person to join our own.
And so, in the face of battalions of business questions, we can become a host unto ourselves.
Footnotes
Footnotes
-
However, in terms of the upstream commerce data, it’s conceivable for items to be added to an order as discrete events first before a final order placement event. An API endpoint for an order being placed might not need to know what’s in the cart, but rather just the who and the when. At that point, it’s dealer’s choice whether to join in items for order_placed or order_details ↩
-
Ask me how I know! ↩
Comments