Analysts make the best analytics engineers

When you were in grade school, did you ever play the “Telephone Game”? The first person would whisper a word to the second person, who would then whisper a word to the third person, and so on and so on. At the end of the line, the final person would loudly announce the word that they heard, and alas! It would have morphed into a new word completely incomprehensible from the original word. That’s how life feels without an analytics engineer on your team.
So let’s say that you have a business question, you have the raw data in your data warehouse, and you’ve got dbt up and running. You’re in the perfect position to get this curated dataset completed quickly! Or are you?
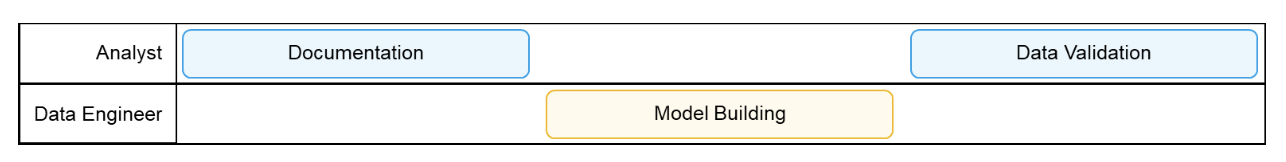
You’ve got three steps that stand between you and your finished curated dataset. If you don’t have an analytics engineer, then the work may be split up like this:
The first step is that your analyst will start researching the stakeholder’s request and will try to boil it down to a high-impact question that will drive the business. What do they really want to know? For example, your stakeholder might come to you with the following:
“We need to be able to track usage of our product, and we’d like to have some data around Active Users.”
Analysts are experts at taking broad statements and turning them into specific pieces of work.
“Some data” could mean:
- A single KPI with a trendline over time
- A dashboard broken out into various categories
- A filterable and queryable table for ad-hoc analysis
“Active Users” could mean:
- Users that logged in during a fixed time period
- Users with a session longer than a certain amount of time
- Users that interacted with a particular feature
From there, the analyst will build out the initial documentation and write down what they want the final dataset to look like. If your analyst is not trained as an analytics engineer, this is the point that they will need to hand the project over to a data engineer to build the model.
The first time that a team of analysts and data engineers builds a curated dataset, they will often expect this process to be a straight line to completion. Expectations are that the process will look something like this:

What quickly becomes apparent is that this push for a linear process often ends up creating three unanticipated “loops”:

Loop 1: Reacting to findings in the raw data
Let’s say that your analyst has defined the business need as an Active Users dataset with “Unique users that log in during a given day”. The analyst will try to do as much discovery work up-front as possible, because it’s hard to predict exactly what you’ll find in the raw data. When a data engineer gets stuck writing a model, they’ll need to reach out to the analyst for some additional discovery. When an analyst-turned-analytics-engineer has a question while writing a model, they don’t need to wait to talk to anyone, and they can begin researching it immediately. Which brings us to our first point:
Analysts already know the data that they want.
If the raw Login dataset below contains two different date (Login_Date and Session_Date) fields, a data engineer would be stuck. They can’t just guess because using the wrong date field will create an entirely different metric! So they must go back to the analyst for clarity on which field to use. We’ve just had a full loop with two hand-offs, and the data engineer hasn’t even begun building the model yet.
| Login_Date | Session_Date | User_Id |
|---|---|---|
| 2022-08-01 | 2022-08-01 | 123 |
| 2022-08-01 | 2022-08-03 | 123 |
| 2022-08-04 | 2022-08-04 | 975 |
| 2022-08-04 | 2022-08-04 | NULL |
In comparison, your new analytics engineer could quickly pivot based on the findings in the raw data. They can skip the endless loops of “discovery”, because they can react in the moment. When they see the two date fields for Login_Date and Session_Date, they can instantly apply their product knowledge, compare against examples, or reach out to their business contacts to diagnose the difference and select the correct date for the model.
If the business need includes looking at Active Users by Groups A, B, and C, then that adds an extra layer of complexity. Without an analytics engineer, you’ll see extra loops and hand-offs to finalize all the business logic, how to handle NULL values, and even just the final format.
Model format returned by data engineering
| Date | Active Users Group A | Active Users Group B | Active Users Group C |
|---|---|---|---|
| 2022-08-01 | 34 | 60 | 61 |
| 2022-08-02 | 77 | 86 | 37 |
| 2022-08-03 | 71 | 9 | 6 |
| 2022-08-04 | 63 | 87 | 10 |
Model format needed for the BI tool
| Date | Group | Active Users |
|---|---|---|
| 2022-08-01 | Group A | 34 |
| 2022-08-01 | Group B | 60 |
| 2022-08-01 | Group C | 61 |
| 2022-08-02 | Group A | 77 |
| 2022-08-02 | Group B | 86 |
| 2022-08-02 | Group C | 37 |
Loop 2: Reacting to unexpected results
Analysts are the first (and sometimes only) line of defense to catch data quality issues. Once a dataset is aggregated down to a single number to answer a business question, it’s often impossible to know if there’s an incorrect filter or wrong set of logic.
When a model is built for the first time, all parties often “don’t know what they don’t know”. As the analyst digs into the curated dataset, they will find updates that need to be made to the model. Hence, our second point:
Analysts question everything.
Group A for Active Users may be focused on Participant roles. The stakeholder had explained to the analyst that they want to exclude any Admins that will have a different experience in the product.
| User_Id | Location | Role | Level | Zone |
|---|---|---|---|---|
| 123 | California | Editor | AAA | 1 |
| 427 | Utah | Participant | ABA | 1 |
| 864 | Georgia | Admin | CCC | 3 |
A data engineer working off of a “build list” will add a filter for WHERE Role = 'Participant'. During the data validation step, the analyst would discover that there is actually a third Role of Editor that no one was aware of. This would create a loop where the data engineer would have to edit the model to replace it with WHERE Role != 'Admin'.
The analyst caught the issue because they have the appropriate context to validate the dataset. Analysts work directly with the stakeholder, so they’ll also be more familiar with company-specific and department-specific acronyms.
As we all know, data validation is an art, not a science. Analysts will employ everything from a “sniff test” (view a random sample of rows) to individual examples (one-to-one exact matching to another system). An analyst will have to use their experience to know when the dataset is “good enough” for the stakeholder and their question since 100% accuracy might not be the goal. And if we're being honest, sometimes being directionally correct is all that’s needed to make a business decision.
An analyst is able to identify which areas do not need to be 100% accurate, which means they can also identify which areas do need to be 100% accurate.
dbt makes it very quick to add data quality tests. In fact, it’s so quick, that it’ll take an analyst longer to write up what tests they want than it would take for an analyst to completely finish coding them.
When data quality issues are identified by the business, we often see that analysts are the first ones to be asked:
- Why are over half of the
User_Idsnow showing as NULL? - Why is this chart showing a User’s
Locationthat’s not in the USA? - Why is the dashboard filter saying that all User’s
Zonesare Zone 2?
This familiarity with what types of data quality issues are the most important to the business means that an analyst can often identify in advance which automated tests should be added to a data model.
Loop 3: Reacting to mismatched documentation
There’s nothing worse than coming back to view a curated dataset months later (or maybe after someone on the team has offboarded) and learning that there is nothing written to explain why certain logic exists. Or worse, the documentation exists but it no longer matches what the model actually does. Which brings us to our third and final point:
Analysts understand the pain of a poorly documented dataset.
It’s much easier to keep to a naming guide when the writer has a deep understanding of the data and how it’s referenced by the business. Analysts are often asked repeat questions by stakeholders, which is extra incentive to create great documentation from the beginning.
A data engineer will document a dataset based on what they needed to know to build it. An analyst with analytics engineering skills will document a dataset based on how to use it going forward.
If we want to know how certain logic was built technically, then we can reference the SQL code in dbt docs. If we want to know why a certain logic was built into that specific model, then that’s where we’d turn to the documentation.
- Example of not-so-helpful documentation (dbt docs can build this dynamically):
Case when Zone = 1 and Level like 'A%' then 'True' else 'False' end as GroupB
- Example of better, more descriptive documentation (add to your dbt markdown file or column descriptions):
- Group B is defined as Users in Zone 1 with a Level beginning with the letter 'A'. These users are accessing our new add-on product that began in Beta in August 2022. It's recommended to filter them out of the main Active Users metric.
In the second example, the documentation is written with the stakeholder and business in mind, and analysts are experts at this translation of the technical to the non-technical.
Are you convinced?
Teach your analyst to be an analytics engineer, so they can do their own model building for curated datasets. You’ll start to see their process evolve into multiple smaller iterations, as they add fields and test them as they build. No loops, no hand-offs, and no Telephone Game. Your new workflow will look a little like this:
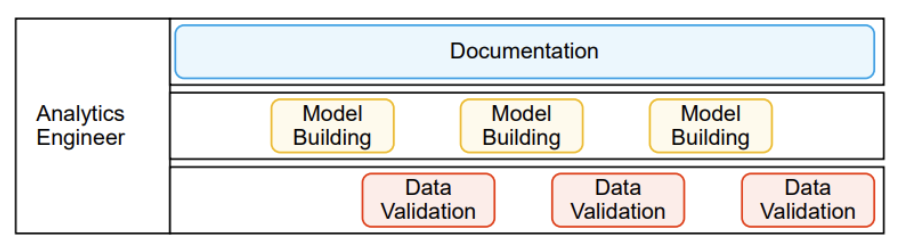
Instead of trying to define all the various groups of Active Users at once, an analytics engineer can be validating the Group A rows, while adding Group B to their local environment, while still working with the stakeholder on the definition of Group C.
All this to say: Your analyst turned analytics engineer is the key to unlocking fast development of curated datasets with next-level data quality and documentation.
How to empower your analysts to level up their skillset
Here are some next steps to get you started on converting your analysts to analytics engineers:
- Many analysts are already very comfortable querying data using SQL Select statements. For those that aren’t, challenge them to start pulling data for ad-hoc requests using SQL. Ask them to compare some of the common transformations in your BI tool to SQL functions or rebuild them using CTEs. This will prepare them for learning about dbt SQL models.
- Start incorporating peer review as part of the dashboard publishing process. Also, consider how you set up your dashboard environments (do you have a local development area, a review area, and a published area?). This will prepare them for learning about Git, development environments, and version control.
- Talk to your analyst about how they decide to create alerts in your BI tool, or any regular reviews that they do of existing dashboards for data accuracy. And what are the current data governance practices that each dashboard follows (Data Dictionary? Style Guide?). This will prepare them for learning about the dbt
.ymlfile.
Learn more on how to apply a fresh framework to existing analytics projects to upskill your Analyst to an Analytics Engineer at my Coalesce 2022 presentation. I hope to see you there!
Comments